


Serverless
Replacing Amazon S3 Events with Amazon S3 Data Events
How to synthesize an (almost) identical payload using Amazon EventBridge rules.

Fri, 22 Jun 2018
For companies coming from an on-premise or traditional architecture, the landscape of monitoring for cloud-based distributed architectures can be pretty bewildering. What metrics should you be monitoring? What tools and providers should you use? How can you centralize the data and correlate it to gain actionable insights about your production systems?
If you’re asking these questions, this post is for you and hopefully it can be a useful primer. We’ll also share a few opinions from Trek10’s experience running our CloudOps managed service.
One caveat: This advice is focused on all but the largest scale systems. If you have a particularly large and complex distributed system, you may need to think differently about monitoring & observability. That said, our experience has been that the majority of even the largest enterprises are focused on apps that don’t meet this threshold and a focus on traditional aggregate metrics is appropriate.
For starters, we find that there are six primary categories of metrics that you need to be thinking about. In future posts we’ll dive deeper into each of these, but let’s start with a high level overview.
Mmm, pie.
Just like an on-premise VM environment, if you’re running VMs (EC2 in AWS) you need an agent running on your virtual machine to collect traditional system metrics: CPU, RAM, disk, and network interface metrics. There are some differences from the on-premise world:
In the AWS world this is CloudWatch. These are critical for EC2 instances (they give you the hypervisor view of your systems) but especially so for all of the other AWS managed services where they are really your only way to get any deeper insight into service health and your application’s operating profile. The AWS tools for exploring and dashboarding these metrics are getting better and better, but you can also export CloudWatch metrics to other monitoring tools.
It is always critical to have a “last line of defense” in terms of monitoring… if all other metrics fail to notify you of an impending problem, or if the metrics themselves are having problems, an external tool that is pinging your public endpoints can independently notify you of an outage as fast as possible.
Whether you are in cloud or on premise, the APM view is critical: from your customer’s perspective, how is your application performing? And if there are problems, where in the flow of a customer transaction are the bottlenecks?
First and foremost, when you move to the cloud you have to ship off your logs. No useful logs should ever be stuck on an instance. But taking it a step further, once all of your logs are aggregated into a single tool you can start charting and dashboarding trends from these logs and correlating to your other metrics.
This final category is often overlooked but critical. Instrumenting your app with a few custom metrics will often really get to the heart of what matters: are the right business events happening and how long are they taking? Custom metrics are also a great way to track your background jobs and other back-end activities.
We’ll cut to the chase here and explain some of our choices of tools & providers.
Datadog: We’re huge fans of Datadog for its ability to handle several of the above categories in a single tool: An agent for VM metrics, CloudWatch integration, and (newer) APM and logging offerings. Also critical is Datadog’s large library of pre-built integrations, so when you need to select another tool for some of your metrics like New Relic, Pingdom, or SumoLogic, that elusive “single pane of glass” is just a few clicks away. Datadog also has one of the most simple and powerful custom metric feature sets around with multiple ways to push metrics with just a few lines of code. The icing on the cake is a beautiful UI and deep set of features for power users. To give you an idea…

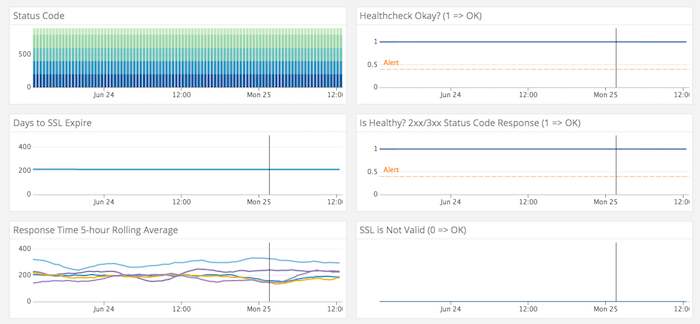
Trek10 Pinger: There’s no lack of options in this space: Pingdom is probably the most well known external uptime monitoring tool and an interesting newer option is Apex Ping. However, at Trek10 we actually decided to build our own to handle our unique requirements as an MSP as well as to tightly integrate it with Datadog. We’ve also added custom features for monitoring SSL and domain expiration which has saved more than one client from the dreaded SSL expiration outage! As heavy Serverless users, we of course built it with Lambda. It runs in five AWS regions globally so relies on no shared dependencies with the workloads it is monitoring, or even shared continents!
Some of our Pinger metrics in a Datadog dashboard:
APM: New Relic and AppDynamics are the market leaders for traditional architectures, and we find those tools to still be the simplest and most robust for EC2-based applications. However at Trek10 we spend a lot of our time with Serverless / platform-service-based applications, and this is a much more wide open space. We’re watching trends closely including both interesting startups like IOPipe and Thundra as well as AWS’s X-Ray service.
There’s a lot more to say about all of these categories, so look for more posts to come. In the meantime, check out the rest of our blog, follow us @Trek10Inc, and let us know if we can help you with your cloud monitoring.
This is the first in a series of posts about monitoring production workloads in AWS. Related posts include.

How to synthesize an (almost) identical payload using Amazon EventBridge rules.


