Spotlight
How to Use IPv6 With AWS Services That Don't Support It
Build an IPv6-to-IPv4 proxy using CloudFront to enable connectivity with IPv4-only AWS services.


AWS X-Ray is a powerful tool that allows you to gain insight into the performance and behavior of your containerized applications. In plain language, this tool, in combination with the methodologies I’ll describe in this post, can help you identify and monitor performance, potential bottlenecks, as well as breakpoints in your application(s) running on several services in AWS. For the purposes of this article, we will focus on an ECS example. X-Ray is particularly useful with regard to system observability as well as SRE. Site Reliability Engineering is an approach to software development that focuses on ensuring the reliability and availability of large-scale, complex software systems. It combines aspects of software engineering and operations to create a holistic approach to building and maintaining software systems. In this post, we will explore how to use X-Ray to improve observability and SRE when deploying ECS containers. There are several tools utilized to gather the data required to create observability for an SRE initiative, let us define and investigate these now.
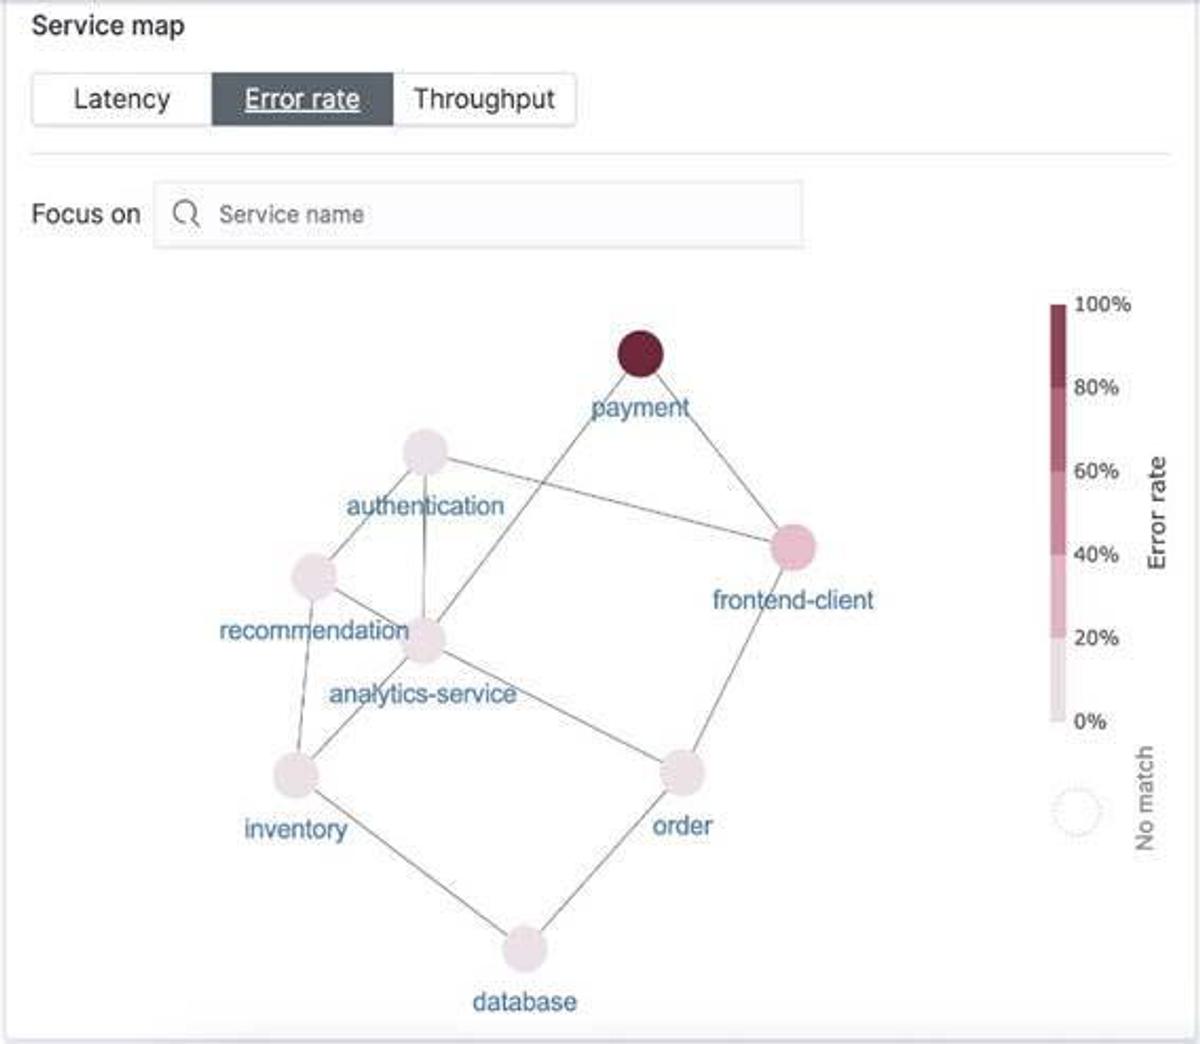
In the following images, you can see how X-Ray traces a request, identifies errors, and shows service map and resource usage.
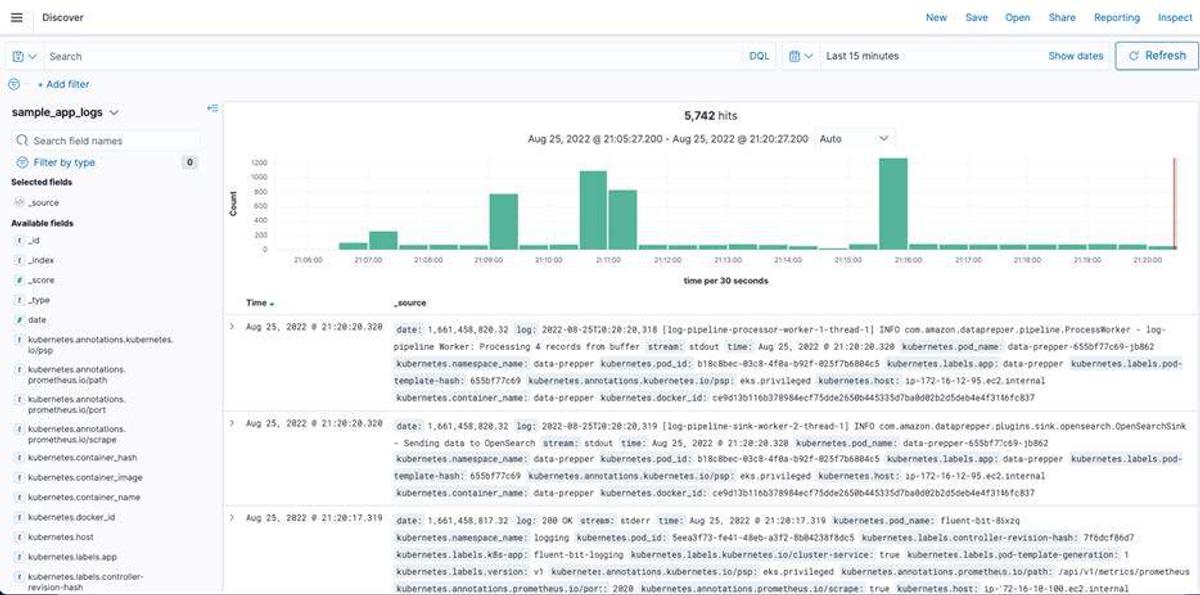
The Discover panel allows you to view and query logs. AWS X-Ray discovery panel offers several benefits over just reading log files.
Firstly, the discovery panel provides a visual representation of the flow of requests through your application, which can be much easier to understand than looking at raw log files. It allows you to see the entire path of a request and understand how different components of your application are interacting with each other. This can be particularly useful when troubleshooting issues, as it can help you identify which part of the application is causing problems.
Secondly, the discovery panel can provide detailed information on the performance of your application. It allows you to see how long each request took to process, and which parts of your application are causing delays or bottlenecks. This information can be used to optimize your application and improve its performance.
Thirdly, the discovery panel can help you identify dependencies between different components of your application. This can be particularly important in complex systems where there are many different services or microservices interacting with each other. By visualizing these dependencies, you can gain a better understanding of the overall architecture of your application and identify potential areas of risk.
Finally, the discovery panel can help you track changes to your application over time. It allows you to see how the flow of requests through your application has changed over time and can help you identify trends or patterns in how your application is being used.
Overall, the AWS X-Ray discovery panel provides a powerful set of tools for understanding the behavior and performance of your application and can help you optimize your application for reliability, scalability, and performance. Check the log activity happening in the microservice application(s) running in your ECS containers. The Discovery Dashboard is a powerful tool that provides visibility into the performance of your application. It provides an interactive map that allows you to trace requests from start to finish, identify performance bottlenecks, and troubleshoot issues. The dashboard also provides detailed performance metrics and insights into the performance of your application. With X-Ray Discovery Dashboard, you can quickly identify and resolve issues, and optimize the performance of your application.
AWS X-Ray is a service that provides an end-to-end view of requests as they travel through your application. It provides an interactive map that allows you to trace requests from start to finish, identify performance bottlenecks, and troubleshoot issues. X-Ray also provides detailed performance metrics and insights into the performance of your application. With X-Ray, you can quickly identify and resolve issues, and optimize the performance of your application.
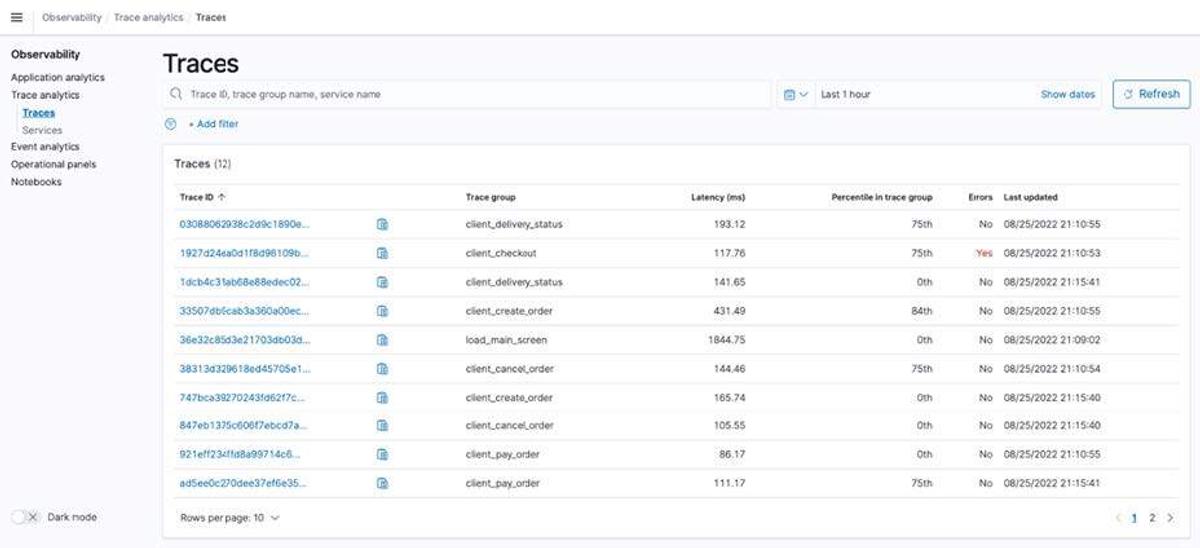
In AWS X-Ray, a span is a way to track a specific unit of work that is being performed as part of a larger operation. Think of it like a "breadcrumb" that helps you trace the path of a request through your application.
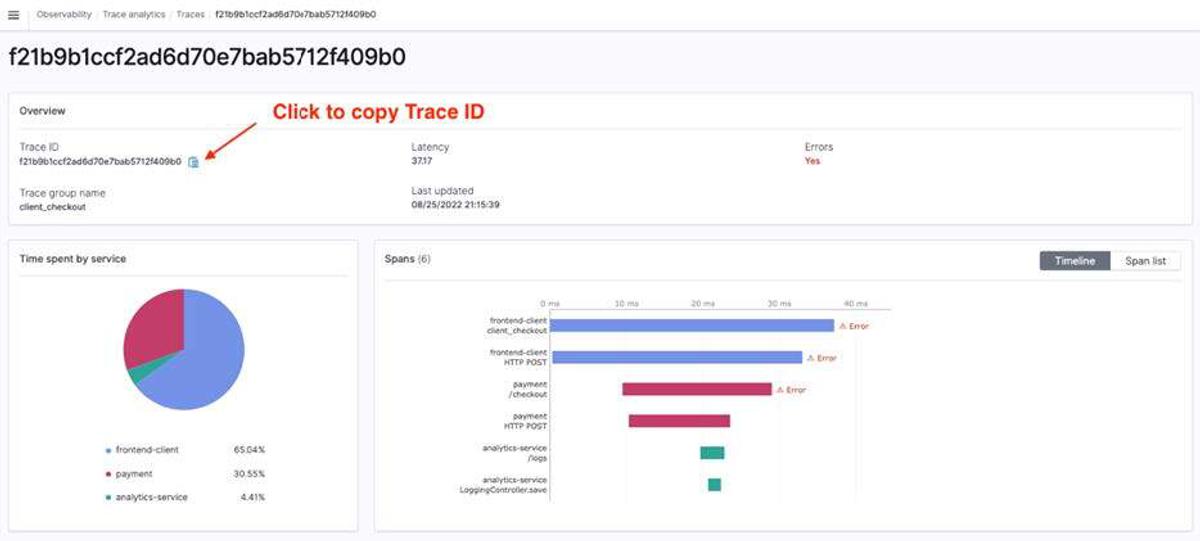
For example, let's say you have a web application that allows users to search for products. When a user enters a search query and hits the "search" button, that request is broken down into a series of smaller tasks, or spans. One span might be responsible for fetching data from a database, while another might be responsible for rendering the search results on the user's screen.
Each span in AWS X-Ray captures information about the task it represents, such as how long it took to complete, which service it was interacting with, and any errors that occurred. By looking at the spans for a given request, you can gain a detailed understanding of how that request was processed and where any issues might have occurred.
Spans are useful for developers because they allow you to break down complex operations into smaller, more manageable pieces. They can help you identify bottlenecks or areas of your application that are causing performance issues. And because they are linked together into a larger trace, you can use them to visualize the path of a request through your application and understand how different services are interacting with each other.
In short, a span in AWS X-Ray is a way to track a specific unit of work that is being performed as part of a larger operation. It helps you understand how your application is processing requests and identify areas for optimization or improvement.
Applications need to be instrumented to generate and send trace data downstream. There are two types of instrumentation:
OpenTelemetry like traces and spans, adding attributes and events, and handling specific exceptions within the code.These instrumentations generate traces of information to developers and site reliability engineers that can help identify errors, bottlenecks, well-behaving microservices, as well as both internal and external API transactions.
Although the log and trace data provide valuable information individually, the actual advantage is that we can relate trace data to log data to capture more details about what went wrong. There are three ways we can correlate traces to logs:
Overall, X-Ray is a great tool to have in your observability and SRE toolbelt when deploying ECS containers. It can help you quickly identify and fix issues and improve the performance of your applications.
In conclusion, AWS X-Ray is a powerful tool that can help you improve the observability and SRE of your ECS containers. By using X-Ray, you can gain a deeper understanding of how your applications are behaving, identify and fix issues quickly, and optimize your application's performance. For a workshop or to set up a proof of concept please check out the workshop located here: Microservice observability with Amazon OpenSearch Service part 1: Trace and log correlation | AWS Big Data Blog

Build an IPv6-to-IPv4 proxy using CloudFront to enable connectivity with IPv4-only AWS services.