Serverless
Replacing Amazon S3 Events with Amazon S3 Data Events
How to synthesize an (almost) identical payload using Amazon EventBridge rules.


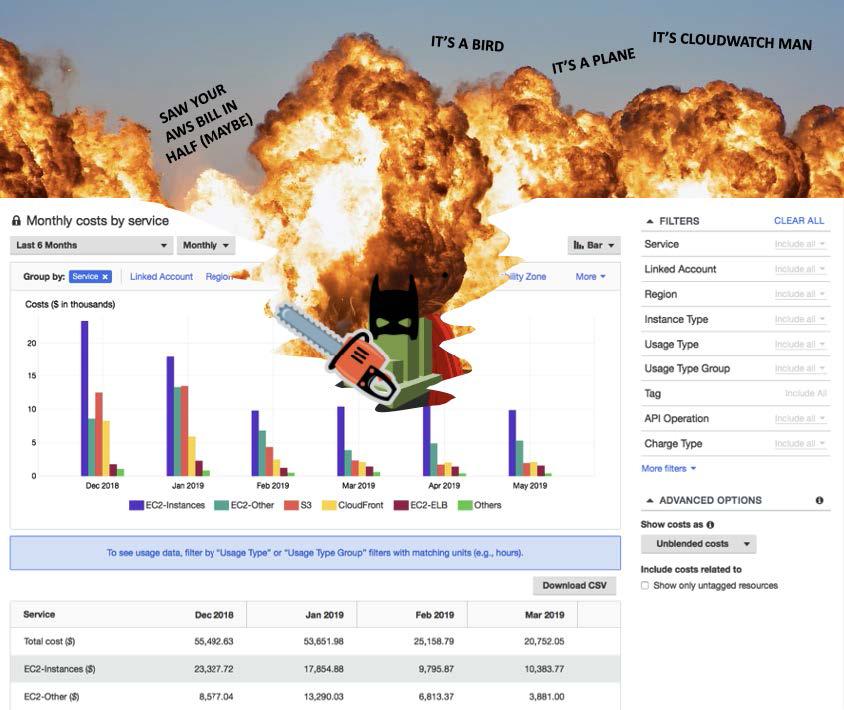
Have you ever been surprised by your AWS bill? Or maybe you inherited an AWS account and were advised – “well it has a few different apps… nobody really knows who owns what, it's just better to not delete anything." Or maybe you just feel that your IT spending hasn’t been checked for rationality in a long time.
Well, today is your lucky day! You are about to discover how to reduce your AWS bill. In this article, we’ll show you how to check for easy cost reductions on the ten most-used AWS services. If at any point you get the urge to talk nuts and bolts on your specific AWS bill, reach out to info@trek10.com to talk with me or one of our team members about your specific use cases.
Google’s top link of "most-used AWS services" lists the following top ten:
S3 is one of the most utilized services across almost every AWS account, which makes it nice that there are some easy ways to reduce S3 costs.
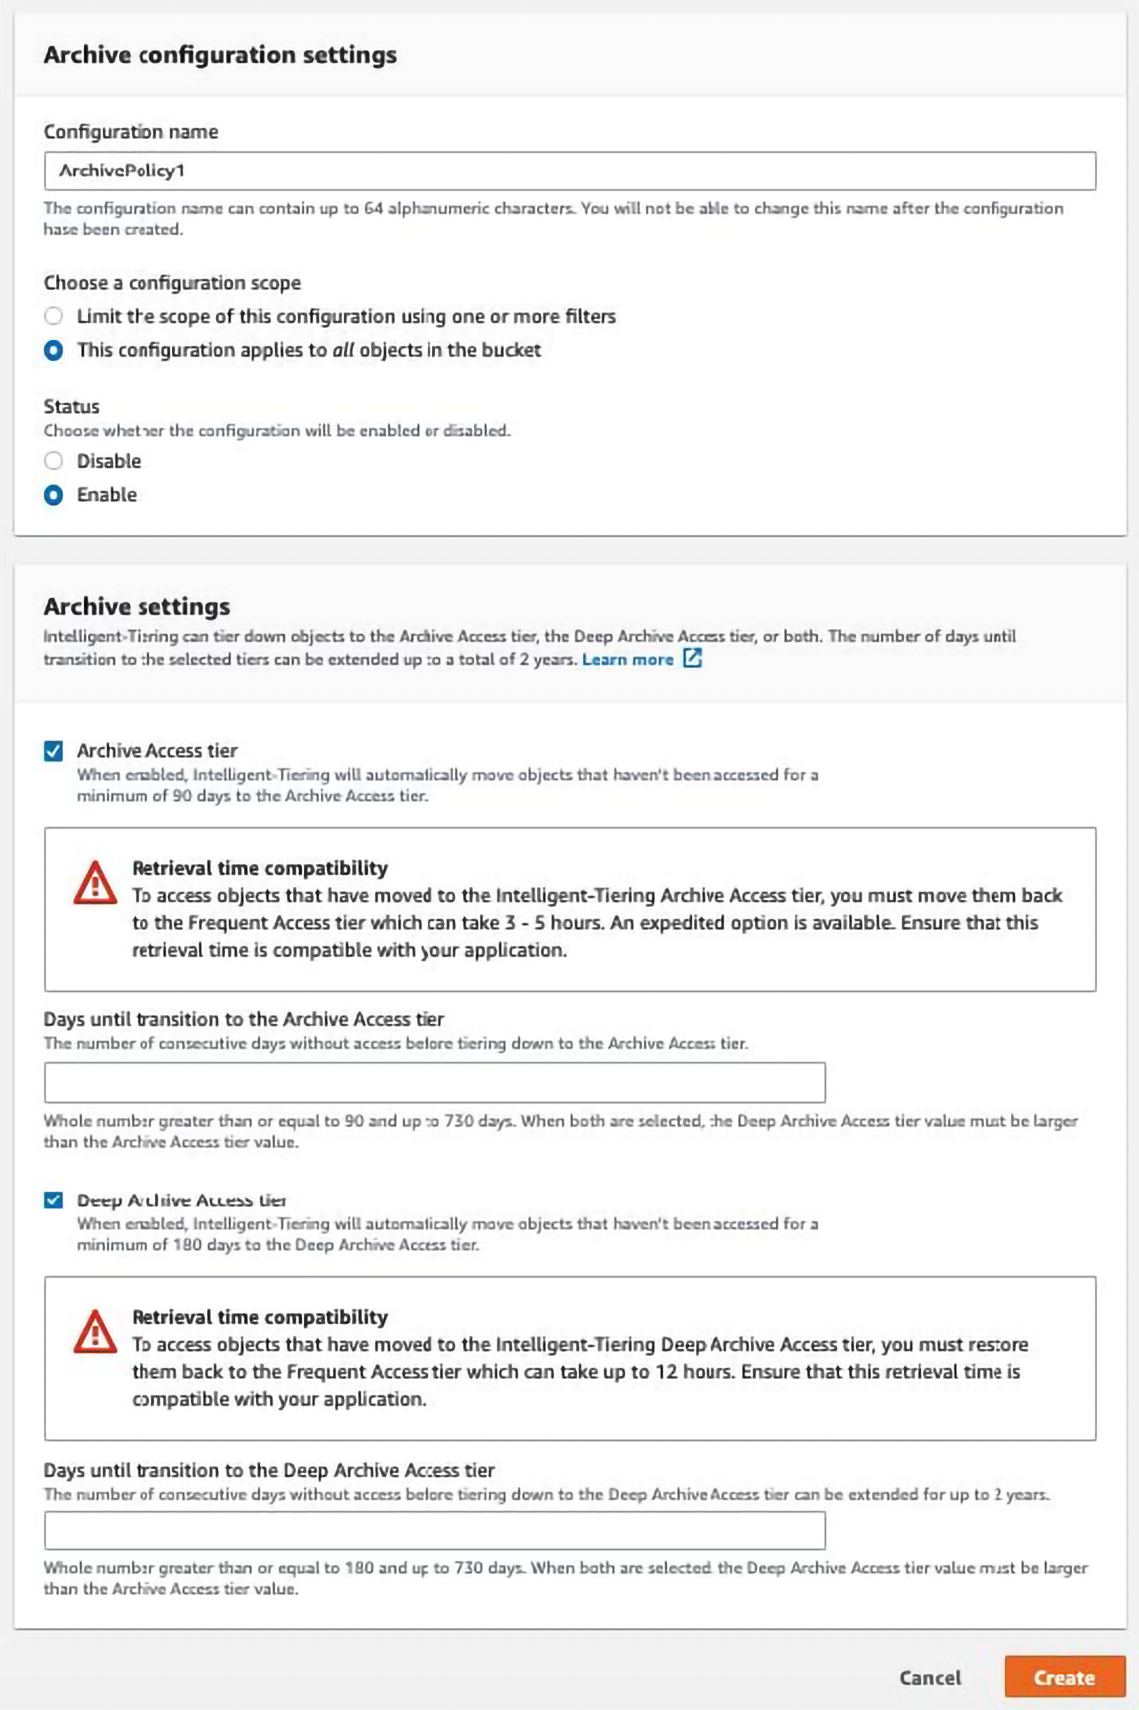
The first thing I recommend is moving all items for which you didn’t intentionally choose a storage type to intelligent storage type. AWS provides a few different ways to store objects, and the way you store them affects how you are charged for them. For example, AWS lets you select a storage plan that costs less to store objects you don’t frequently look at, but costs a little more every time you do look. This is called the Archive Access Tier. The genius about “intelligent” pricing is that AWS will use their storage metrics to let you automatically move items that are not being used to the Archive Access Tier. If you are wondering how to enable this intelligent pricing go to:
https://s3.console.aws.amazon.com/s3/bucket/YOUR_BUCKET_NAME_HERE/property/int_tiering_config/create?region=YOUR_REGION_HERE and enable the configuration.
If you have objects that are edited often (you can use access logs to check out how often they are edited) and those objects have versioning enabled, then you can disable versioning to save money. If versioning is enabled, then every time an object is modified or deleted AWS makes a backup that you pay for. By disabling versioning, you will lose both the backups going forward and the cost you would have paid for those backups. Or if you want to retain those backups for a short time but want to minimize your cost, consider using lifecycle rules to expire old versions(see more details on how to do this below). Note that you will need to go in and clean out old backups that were already created.
If you need the backups, consider periodic backups (once a week or once a month) rather than versioning.
Another suggestion that you may have heard before and heard above but that bears repeating is to use Lifecycle rules to expire old objects. AWS lets you set up items to delete after n days.
You can reduce your bill by using this feature on every bucket where it makes sense. Specific instructions on enabling lifecycle are short and sweet. Go to https://s3.console.aws.amazon.com/s3/management/YOUR_BUCKET_NAME_HERE/lifecycle/create?region=YOUR_REGION_HERE and fill in the rules you want. Here is an example that expires old objects, and eventually deletes them.
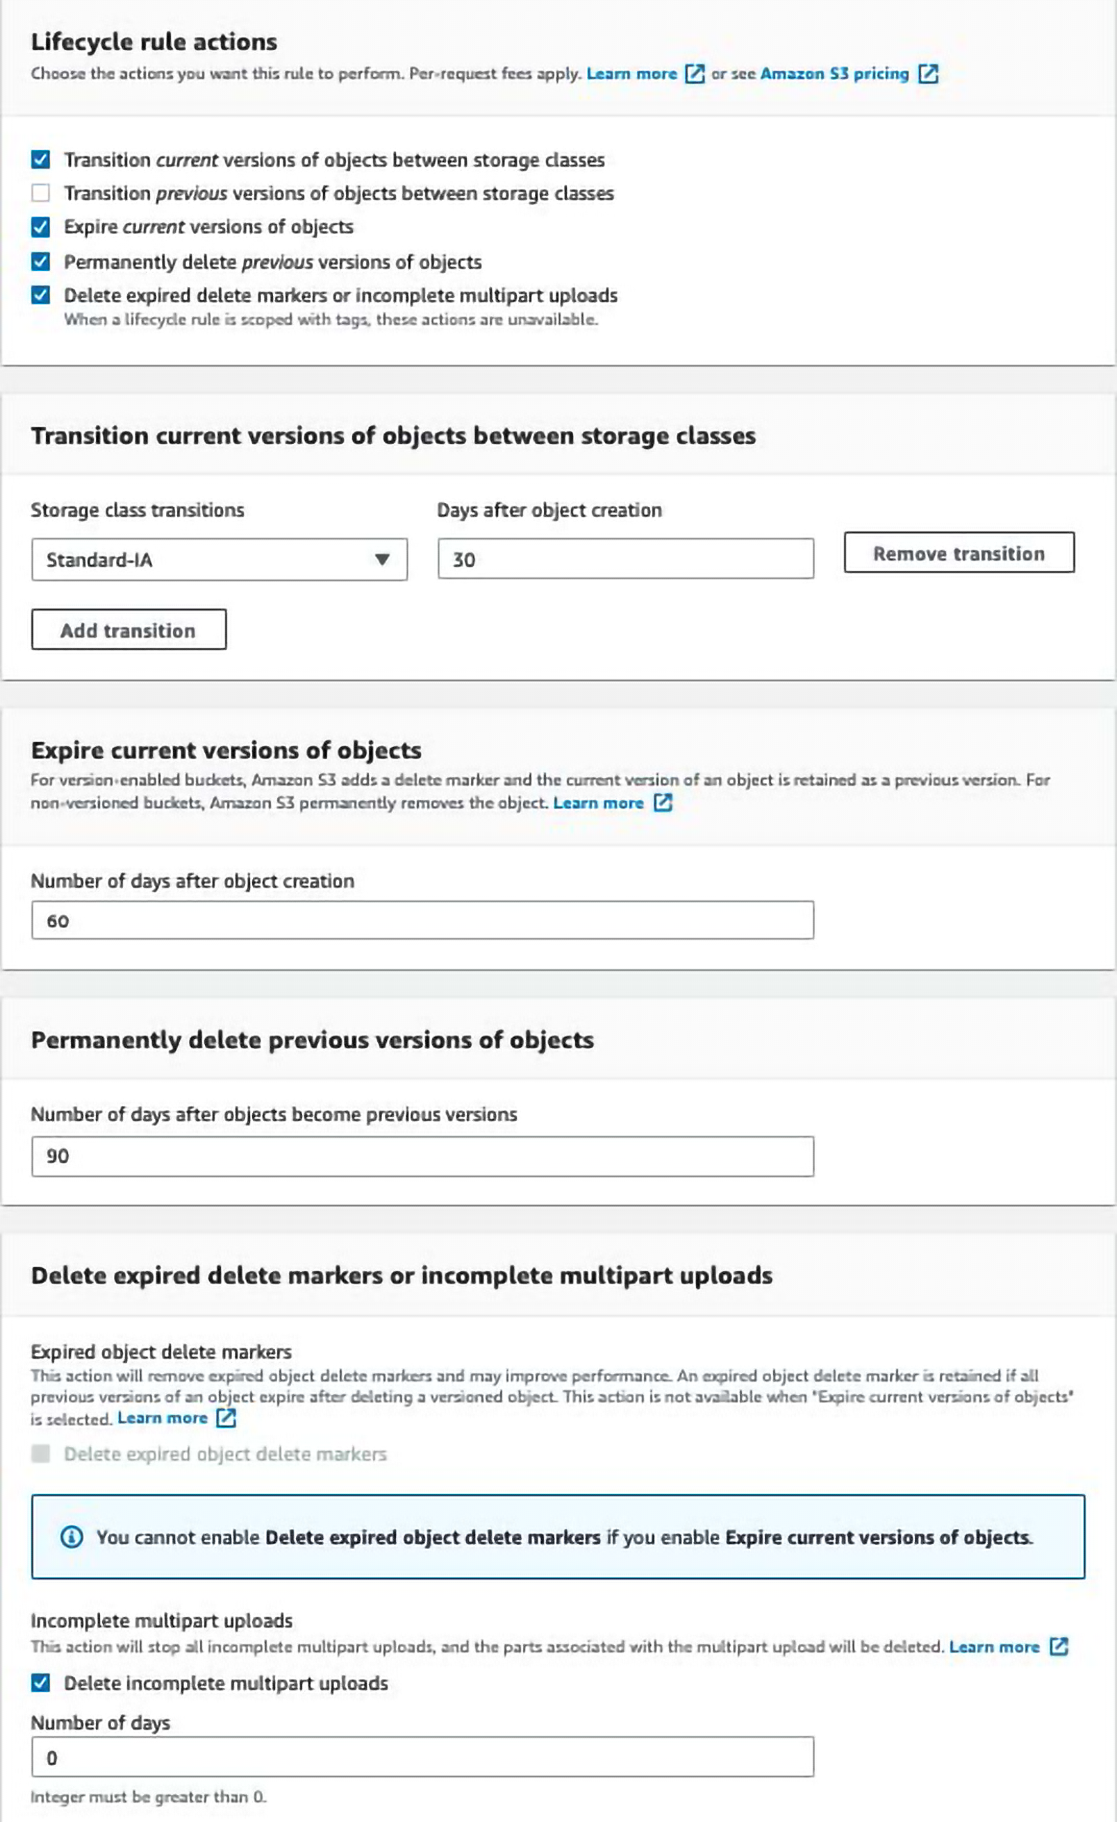
You may have also noticed that the screenshot above includes “Delete expired delete markers or incomplete multipart uploads.” When uploading large objects to S3 multipart uploads that fail just lay around until you come in and clean them up, free savings galore!
EC2 billing is arguably the most straightforward but also the hardest service to save money on. It boils down to: (1) don’t over-provision, (2) turn off what you’re not using, and (3) tell AWS what you plan to use.
Not over-provisioning sounds hard. And in part it is, but AWS gives us ways to help. You can go to Trusted Advisor and see which EC2 instances are not right-sized by going to the Trusted Advisor Cost Optimization console and looking at the section for “Low Utilization Amazon EC2 Instances”. I would recommend resizing by 1 instance size at a time while confirming you aren’t having any issues.
Maybe you have a dev account (or a prod/dev/everything account) and there are EC2 instances, and they are used… but maybe not all the time. In this case “turning off what you’re not using” becomes more complex, but not undoable. Here at Trek10, we give our clients access to our own “EC2 Instance Napper” which uses AWS tags to turn off EC2 instances during the time windows they are not being used, and automatically turning those EC2 instances back on when it's time for work to happen. There are many other solutions for this, from writing your own scripts to using EC2 Instance Scheduler. (Bonus points if you don’t know what a specific EC2 instance or set of EC2 instances is used for.) This is a great tool to start the “scream if it breaks” test by turning instances off for longer and longer each day until they are permanently off.
Finally, and another one that you may have heard of before – Use RIs or Savings Plans. AWS will charge you less if you just tell them how much you will spend on compute resources. I know, I know. You want to say “but I don’t know what needs to be on, I can’t commit to having a certain compute capacity in 11 5 2 months”. I am here to tell you… yes, you can! Just commit to the tiniest savings plan you can imagine. And as you get more comfortable committing, it will feel good and start the ball moving towards more savings.
This one isn’t as easy as the others. For starters, if you’re using Lambda you are likely saving yourself a bundle compared to using other compute resources, so pat yourself on the back. The best way to save money while using Lambda is to find the optimal memory settings, or as I like to call it, the “money spot”. AWS charges you for Lambda based on a formula that uses the number of Lambda executions, how long each execution took, and the memory the execution had allocated. Your number of invocations is likely relatively predictable, but as you add more memory the function may run quicker. This means that by tweaking the memory allocated setting you can optimize the cost.
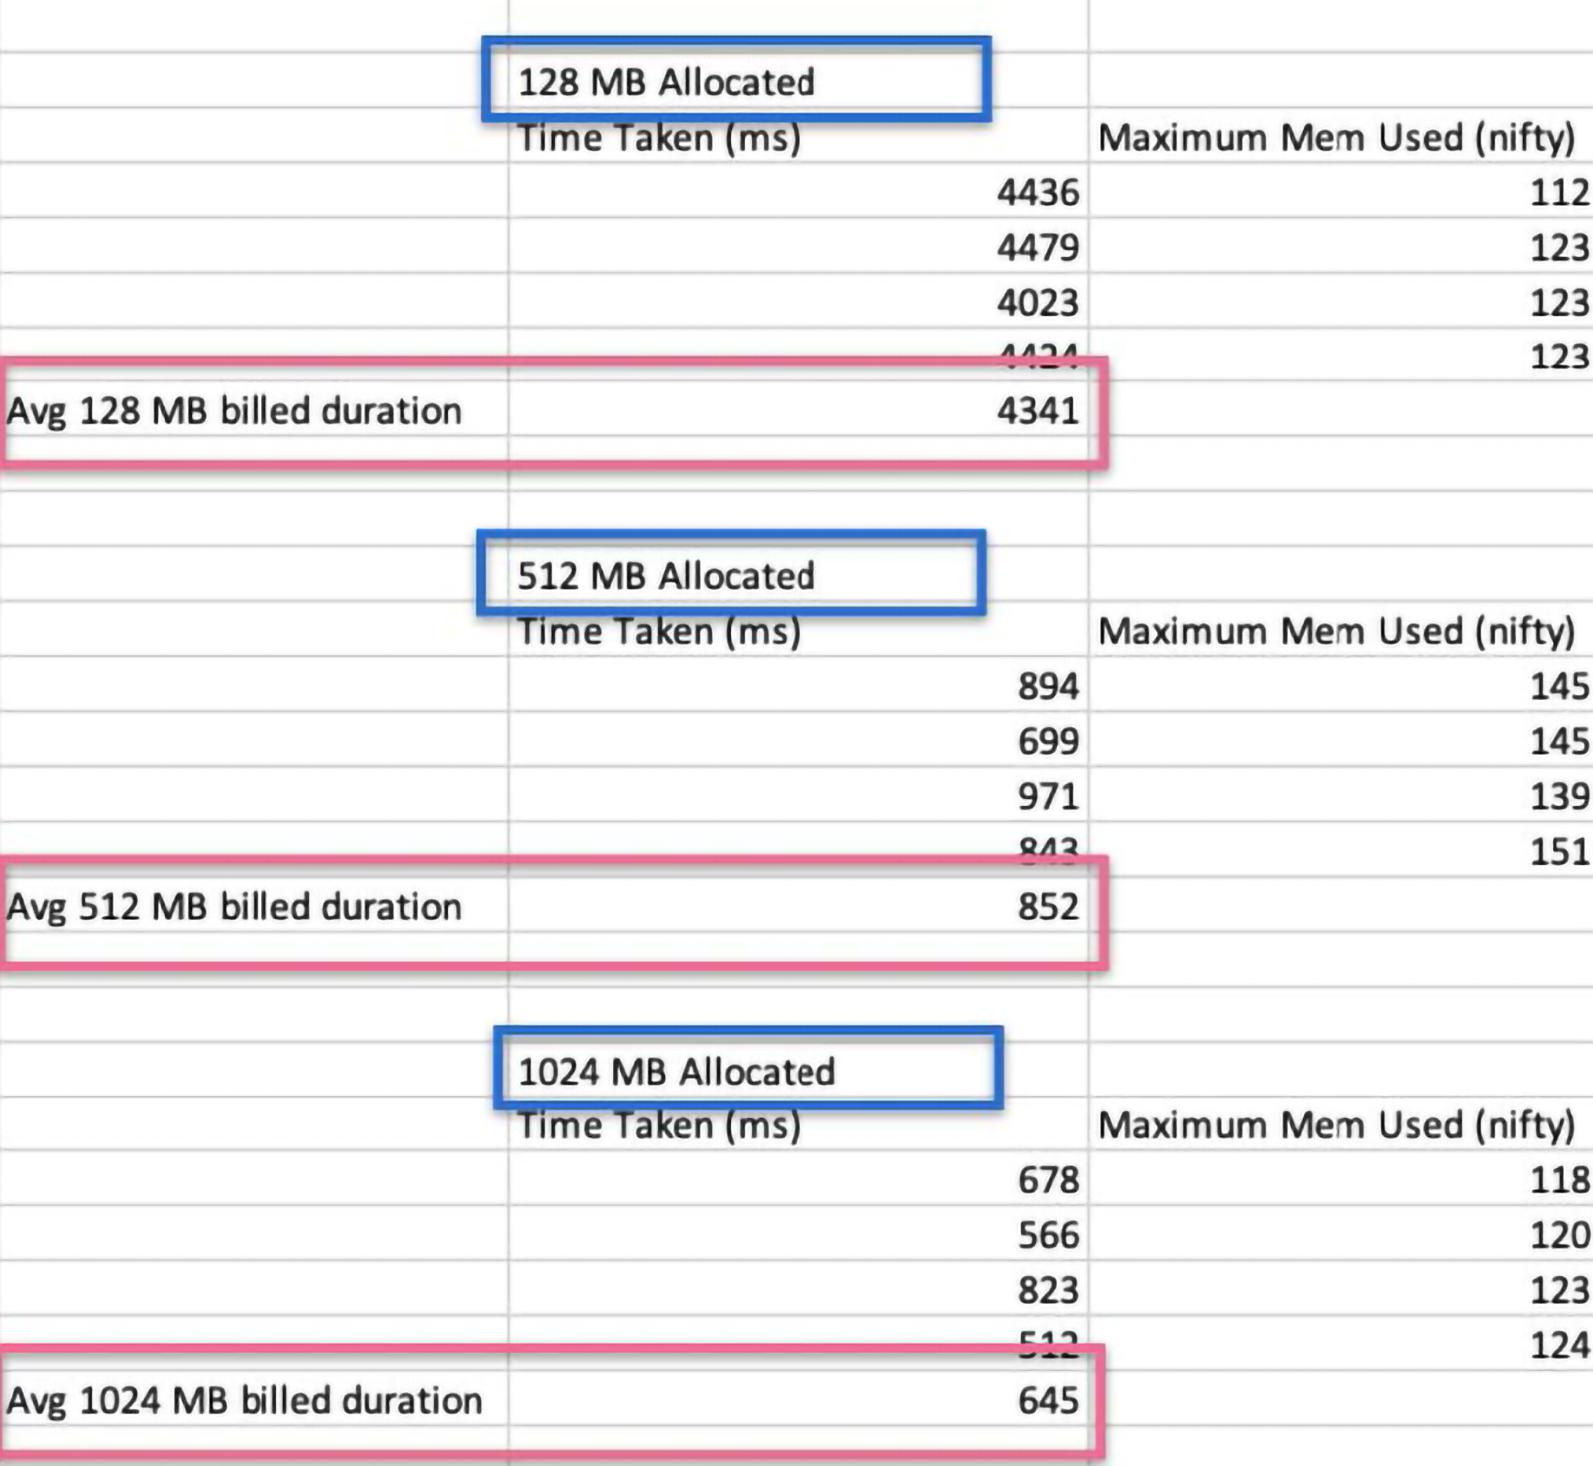
To find out the “money spot”, we will need to test a few different invocations with a standard payload while tweaking the memory set on each invocation and recording how long the invocation took. My example below takes a basic Lambda function that is pulling information out of S3 and tries three different memory settings: 124 MB, 512MB, and 1024MB. To follow along, pick some memory thresholds and go to the Lambda console. Then manually invoke the function and write down the time allocated (see pink square) and the memory allocated (see blue square). Note that my Lambda does the same thing no matter the payload, but be sure to put in similar/the same payloads while testing, if not payload agnostic.
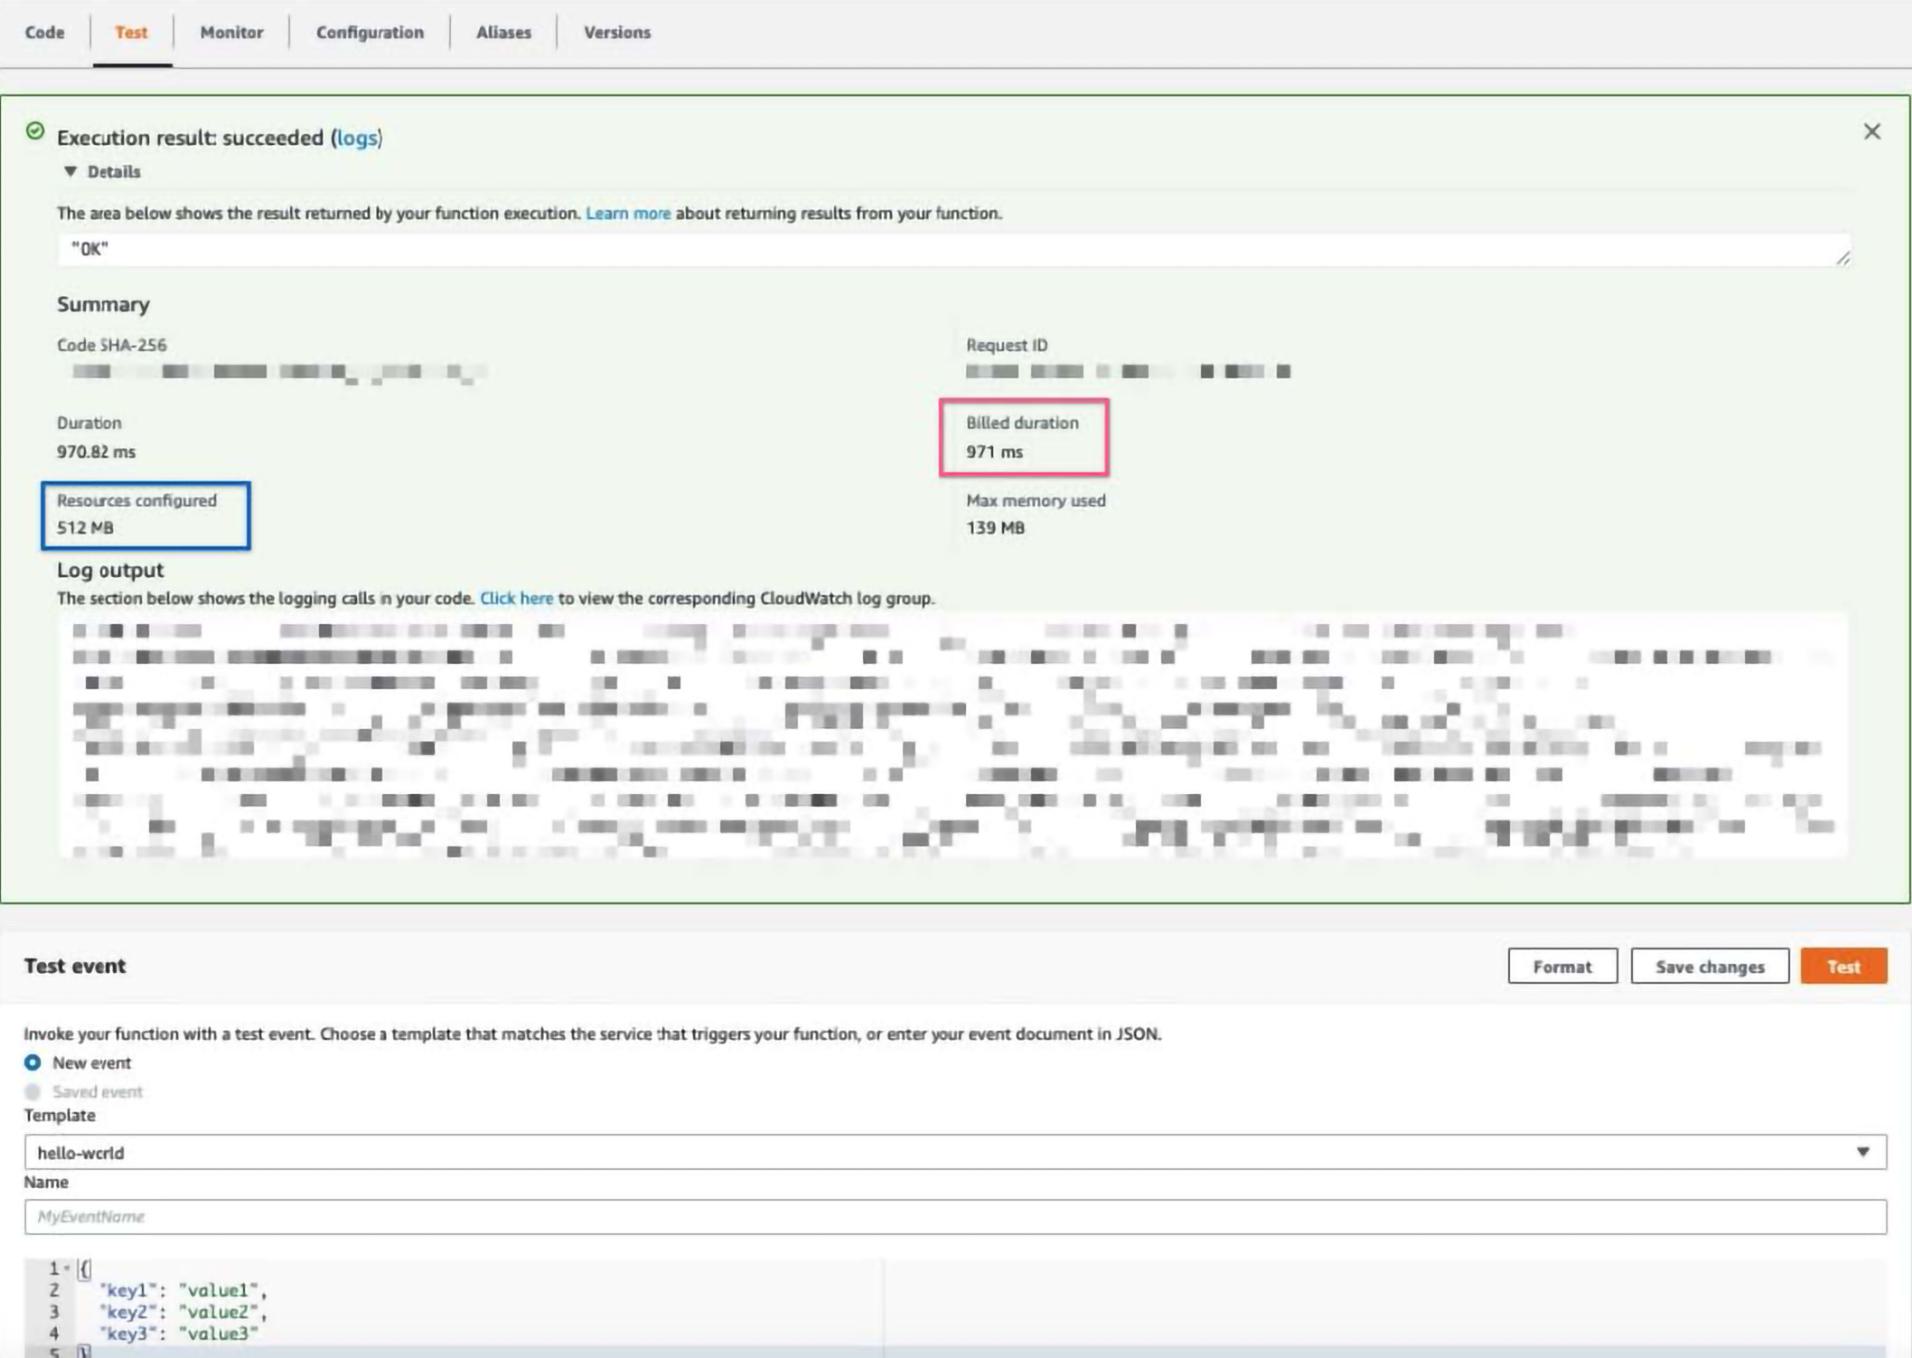
To get an accurate estimate of the average runtime, I recommend doing this multiple times for each memory setting. My example does only 4 invocations, but I would recommend doing at least 20 tests back to back and taking the second 10 invocations (the first 10 invocations help avoid cold starts).
Once you have an accurate average duration for each associated memory setting, head over to https://aws.amazon.com/lambda/pricing/ and go to the lambda calculator. I am using an example of 1,000,000 invocations and filled in each average duration as well as the memory allocated.
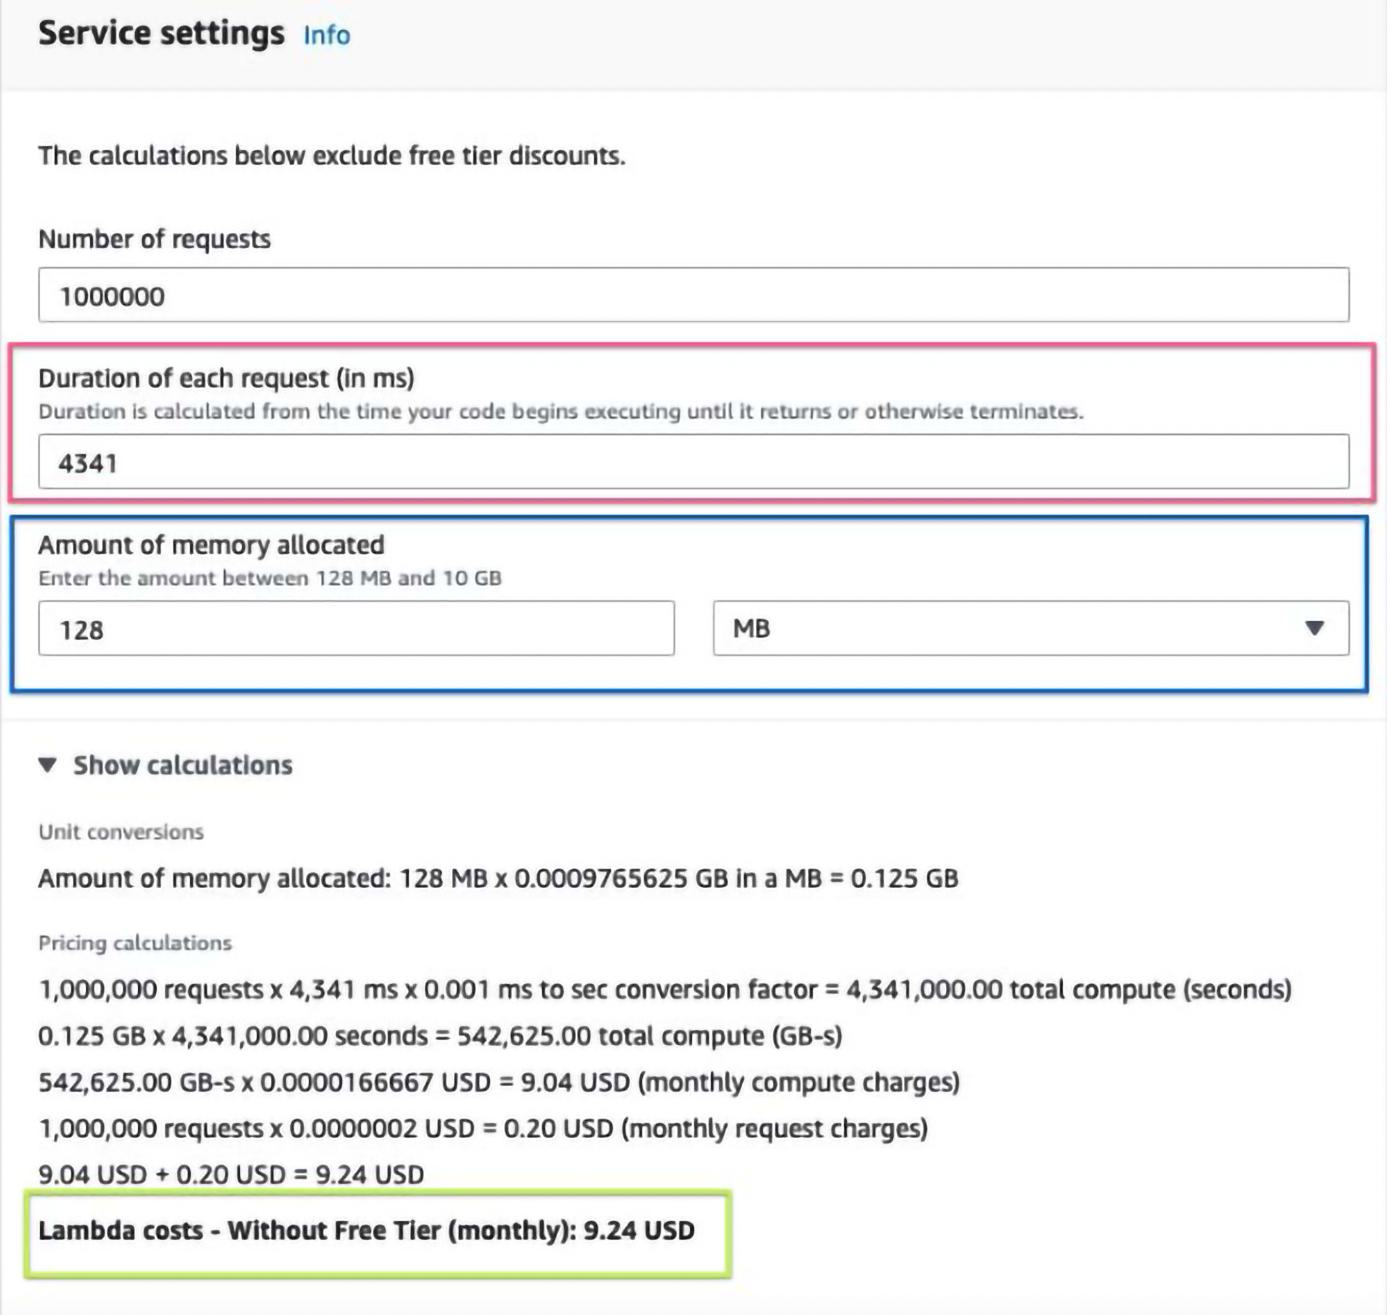
The prices ended up being:
128MB: 9.24 USD
512MB: 7.30 USD
1024MB: 10.95 USD
So in our example, the “money spot” memory setting is 512MB.
After reading the above cost breakdown steps, depending on your background, you may be craving a more automated way of determining the optimal memory setting that involves fewer google sheets and more code. Well, are you in luck! Check out AWS Lambda Power Tuning, which is an open-source project that will let you deploy step functions to test memory settings in a code-defined way. And finally, I would be remiss not to mention AWS’ own version of solving this problem: AWS Compute Optimizer.
SNS is a heavily “managed” managed service. This means that there are not many levers to pull to reduce the bill. The quickest and easiest way to make sure your SNS costs are as low as possible is to make sure you are using either us-east-1, us-west-2, or us-east-, 2 as those have the lowest costs across-the-board for SNS API calls & delivery methods, although many regions are tied for at least some API calls/delivery methods.
Good old CloudFront. It’s DIRT cheap until it isn’t. If you are in the scenario where CloudFront is a large portion of your bill, and wondering what went wrong, please reach out and let us help. While you are drafting your message to info@trek10.com go ahead and pop open the AWS console in a second monitor so we can start on the damage control.
First things first, let’s grab the easy wins. CloudFront basically stores your content all over the globe, and the more places AWS stores it, the more they charge you. To reduce your CloudFront bill, you can reduce the number of places where AWS stores your data by going to the console and clicking the edit on settings, and change the price class (follow the red circles).
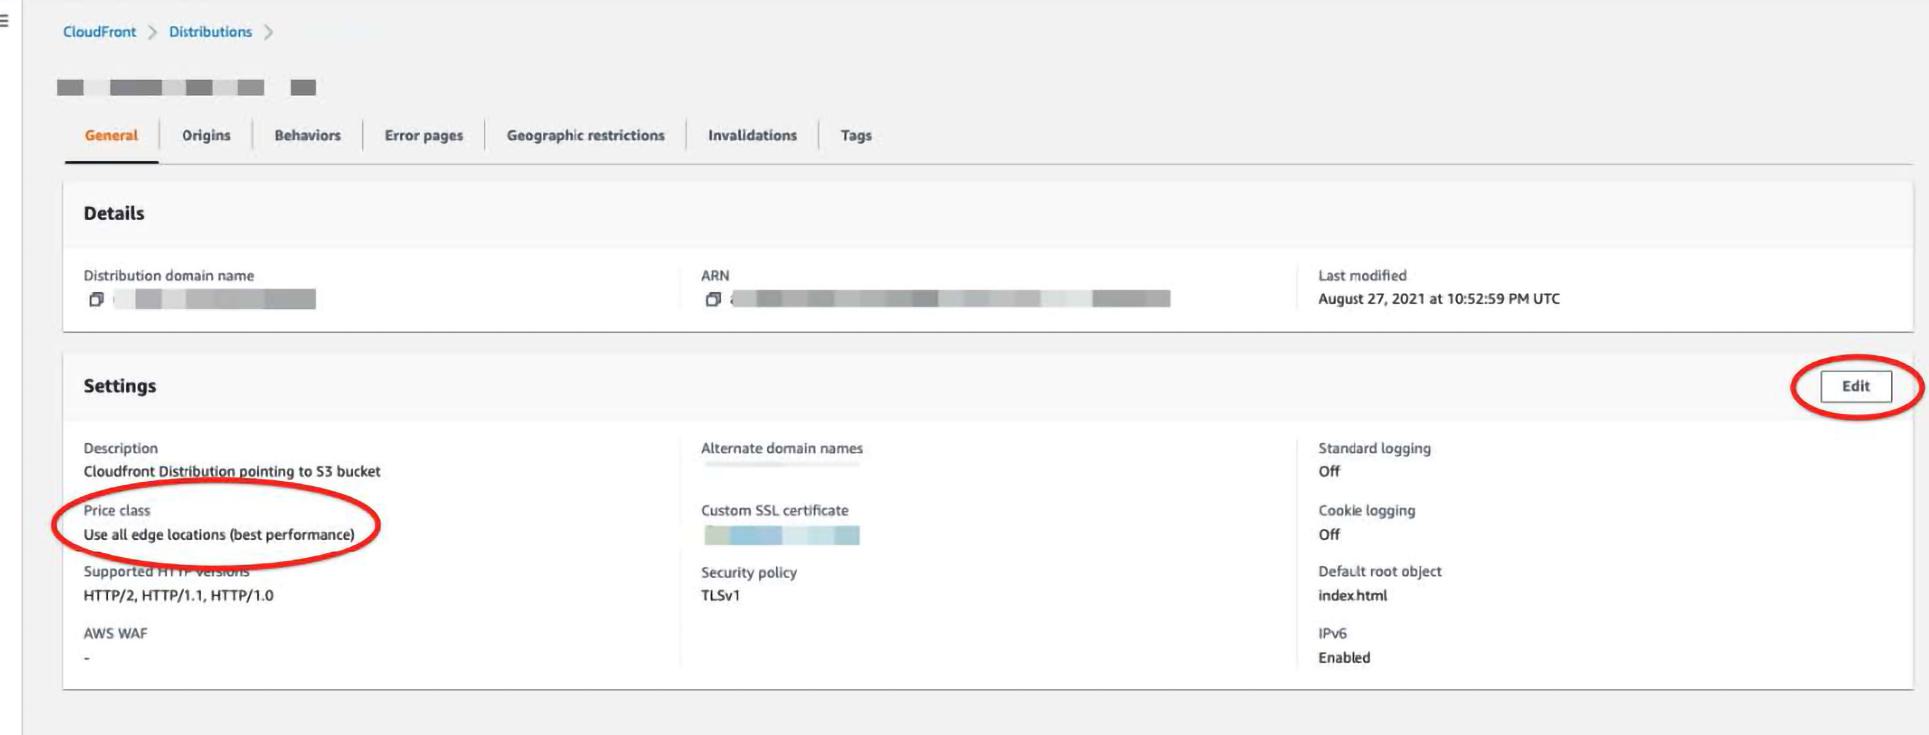
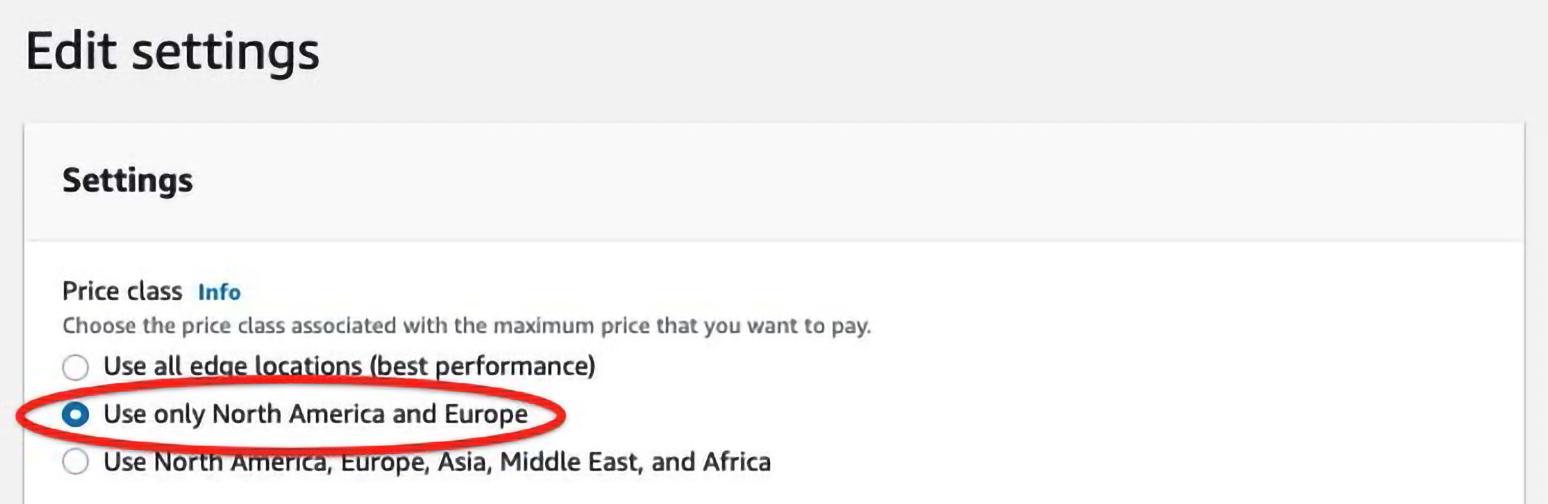
Note that this will mean your content being served to non-US/EU regions will be slower. If this will cause problems for your business, then maybe this is not a cost to reduce.
Second, if you are distributing lots of traffic, you can reach out to AWS and let them know that you are willing to commit to 10+ TB of data a month and start haggling. I would recommend discussing with an AWS professional certified architect before committing to 10+ TB of CloudFront data to see if there is maybe a better way to distribute the necessary data.
Finally, while AWS is storing your content all over the world, they charge you by how much data is pulled down from CloudFront. By telling your customers to cache the data in their browser for longer, they will reach back out to AWS less often and thus pull less data down. Note this does mean people going to receive content from you may not get the most up-to-date content, as they will have a cached version in their browser. So this is a solution where you tune things based on how often you update content. To get a better understanding of how to edit caching instructions, AWS has some helpful instructions here.
My favorite two ways to reduce EBS costs are a real hit at parties. Mostly because they are quick and easy. The first is using AWS’ Trusted Advisor. They have many different cost optimization checks to look at, but specifically, take a peek at `Underutilized Amazon EBS Volumes`. This is a section that shows you all EBS volumes it thinks can be made smaller or EBS volumes that are not attached to instances (and thus can likely be cleaned up unless they are being used in some other way like backups).
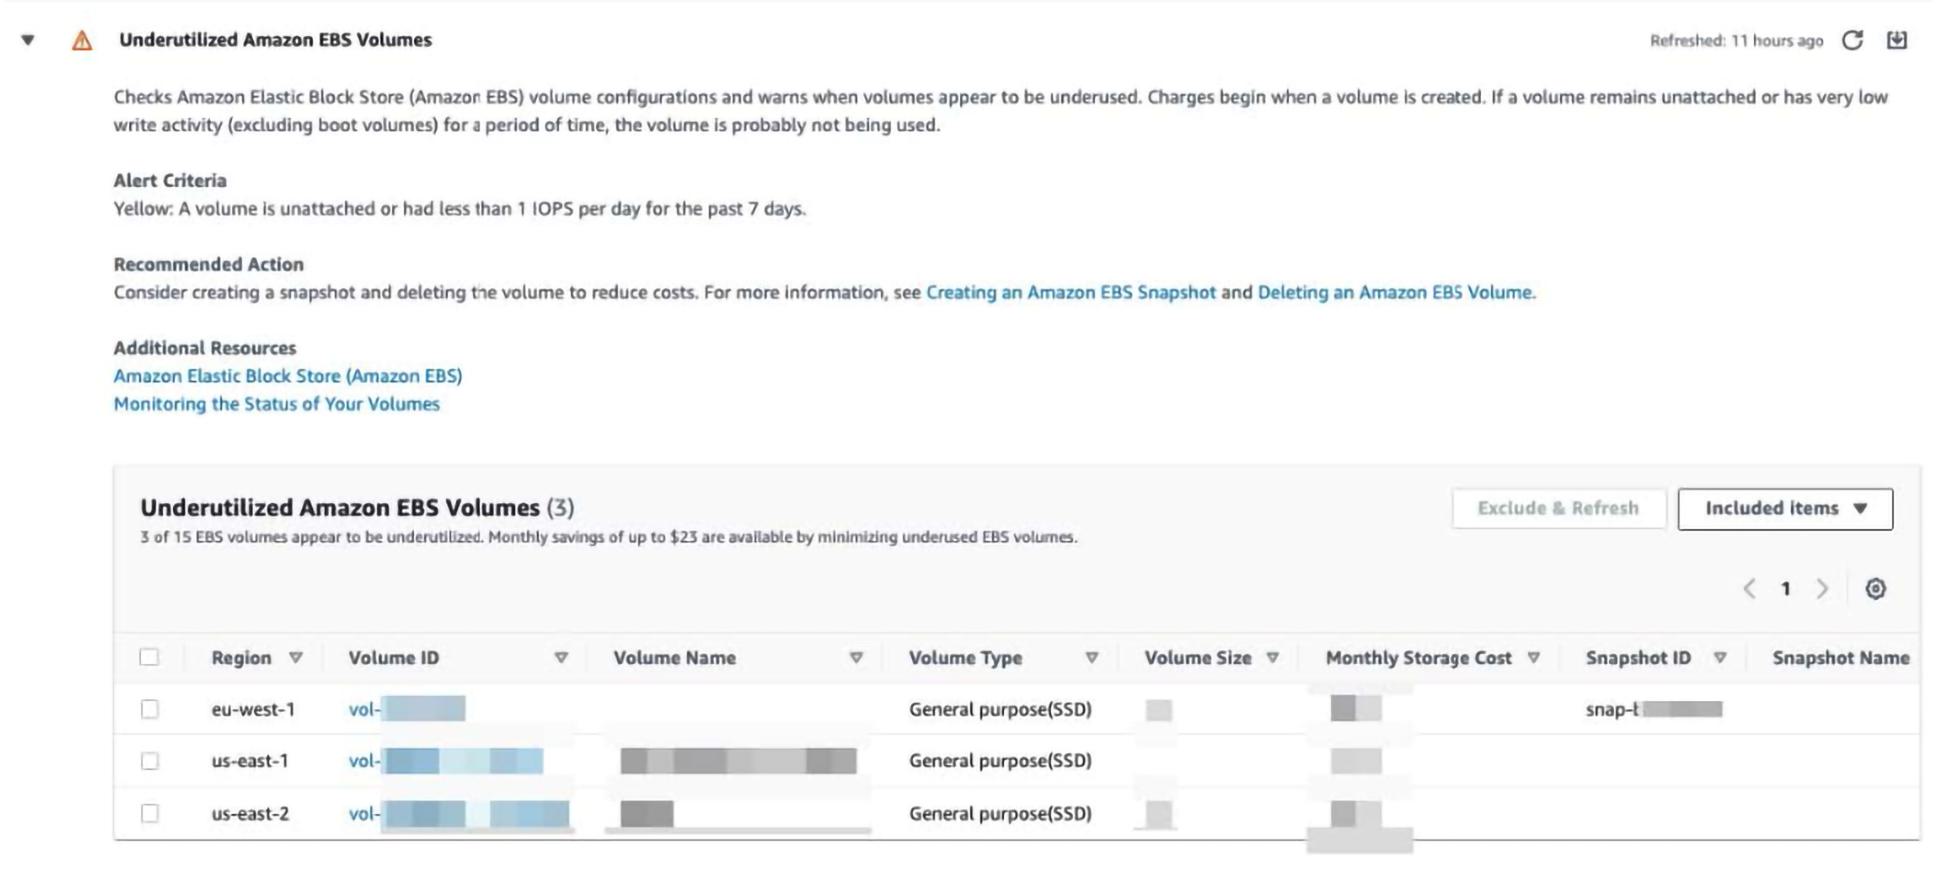
All you need to do is go click on each volume ID hyperlink, and if the volume is not in use, delete it! If it is in use, you should look into reducing the EBS volume size (which is slightly tricky but follow the instructions here and you should be okay).
The second check you can do is on whether you have any EBS volumes with the type `IOPS`. To check this, enter the following URLs (be sure to replace the region with whichever active region you use):
You will want the console to look like this:

But if you do see EBS volumes with the volume type io1 or io2, go over to CloudWatch and see if the EBS volumes usage lines up more with general purpose or IO volumes at documentation. If the IO volumes aren’t being used past the general-purpose thresholds, consider switching the volume type as per the AWS documentation.
Kinesis is a doozy. There aren’t a ton of quick and easy changes to reduce your bill without making application changes, so we will split them into less application conditional and highly application conditional.
Less Application Conditional:
First, see if you can reduce the number of shards supporting one stream. A single Kinesis shard can support up to 1MB/sec & 1000records/sec for input and 2MB/sec for output. To see how many records your Kinesis stream is using, go to CloudWatch and look at the following three metrics (at the stream level): GetRecords.Bytes, IncomingRecords, and IncomingBytes. Next, you will want to look at the sum of the metrics and be mindful of the interval (as the metrics above are in seconds). Then you will want to see how many shards the stream has.
Now, make sure your kinesis streams data retention is as low as possible. To do this use the following commands in your CLI:
aws kinesis list-streams --region <<region-here>>aws kinesis describe-stream --stream-name <<stream-name-here>> --region <<region-here>> | grep "Retention"aws kinesis increase-stream-retention-period --stream-name RawReports --retention-period-hours 24 to reduce retention
More Application Specific:
These next steps may require more fancy footwork than our previous steps, as they will require application knowledge. To keep this blog post as application generic as possible, I will give a high-level explanation and link to more specific instructions at the end of this section. When your application puts records onto Kinesis, AWS will only accept payloads of 25KB chunks. If you want to submit 26KB it will require 2 put requests or if you want to submit 50KB worth of data it will also require two put requests. Now if your application sends payloads as the application finds them you end up making PUT requests with dead space. For example, if your application submits two different PUT requests, one with 14KB worth of data and one with 2KB worth of data, the first request has 11KB of not used space and the second request has 23KB of not used space. If you modify your application to bundle the 14KB and 2KB payloads into one 16KB payload, you only have to pay for 1 PUT request instead of 2. To get a real in-depth breakdown of how data aggregation can save you money, check out this other cool post.
There are many ways to reduce the between-application traffic and thus reduce the costs associated with VPC. I will focus on the method that we at Trek10 have most often seen as an “easy win” in the wild. If your EC2 instances are talking with S3 or DynamoDB in the same region, then you may see a portion of your AWS bill be for NAT gateway traffic. AWS sees applications going over NAT gateways to talk to S3/DynamoDB as something “outside” AWS delivering data into AWS. AWS makes you pay for the data you send from outside AWS into AWS with data transfer charges. AWS taketh away and giveth… namely AWS also provides us with Gateway VPC endpoints. Gateway VPC endpoints let you transfer data between your VPC → Dynamodb or VPC → S3 in the same region for free. To set up Gateway VPC endpoints is actually quite easy, but I don’t believe in re:inventing (pun intended) the wheel so I will just link AWS’ instructions here. If you need more help reducing your VPC bill check out this blog post by CloudZero.
I know what you’re thinking… well maybe I don’t. But if you have spent time trying to reduce your SQS bill then you may be thinking “please don’t pitch me an expensive and somewhat complex batching code update that will need tons of testing.” The good news is that this blog is focusing on EASY wins, so I will give you a tl;dr on the batching app update and then slide in with an easier win (that still requires some application changes, for which I am sorry).
SQS messages can be up to 256KB, but if a message exceeds 64KB the message is broken into 64KB request chunks and sent as separate SQS messages (i.e., sending a singular 150KB message gets broken into 3 messages and billed as three requests, not one). To reduce your SQS bill you could write a fancy batching function that aggregates messages and compresses them into 64 KB chunks, if this sounds like something you’re interested in, I would recommend reading this blog, and if you still have questions please don’t hesitate to reach out to us.
Now for the easier change. The way SQS works, you pay if you call a ReceiveMessage API call whether you get any information or not. That’s right, all API calls count as requests and get billed, even the empty ones. So if your app is set up in a way that it has to reach out to SQS to see what messages are available, then you may be costing yourself extra money with a bunch of calls to AWS that return empty payloads. But HUZZAH, AWS gives us the solution for this… you can tell AWS to wait n seconds (where n is between [1-20]) to see if there is a message in the queue after requesting the information. Said another way, you can set AWS to wait up to n seconds before returning information if there is nothing in the queue. Assuming your application is okay waiting, this is a fairly easy change:
sqs = boto3.client('sqs')

# Create a SQS queue with long polling enabled
response = sqs.create_queue(
    QueueName='EXPENSIVE_QUEUE_NAME',
)

sqs = boto3.client('sqs')

# Create a SQS queue with long polling enabled
response = sqs.create_queue(
    QueueName='CHEAPER_QUEUE_NAME',
    Attributes={'ReceiveMessageWaitTimeSeconds': '20'}
)
Even better, if your application doesn’t need the information in a time sensitive matter, just stop reaching out to SQS as much (maybe only drain the queue at specific time intervals).
Technically, CloudWatch metrics are not in the top 10, but I have quick tips to reduce your bill AND I cheated by combining S3/Glacier, so I thought I might as well throw it in. This tip will only help for people who are using a monitoring tool that is ingesting CloudWatch metrics, such as Datadog (which we recommend – check out all the cool stuff we do with Datadog here). At a high level, what these types of monitoring tools do is to reach out to AWS every n minutes and grab a list of metrics including x,y,z services. To reduce your bill, you can increase n so that you go back to AWS less often, meaning fewer API calls, meaning a lower bill. Or, you can reduce the number of services, fewer services meaning fewer API calls, meaning a lower bill.
If you are wondering how much money you can save with this, first to go to Cost Explorer and see if you have a large bill for the API action “GetMetricData” click here for a prepopulated cost explorer query.

In the picture above, this AWS account is spending almost 1000$/mo on CloudWatch get api cost alone.
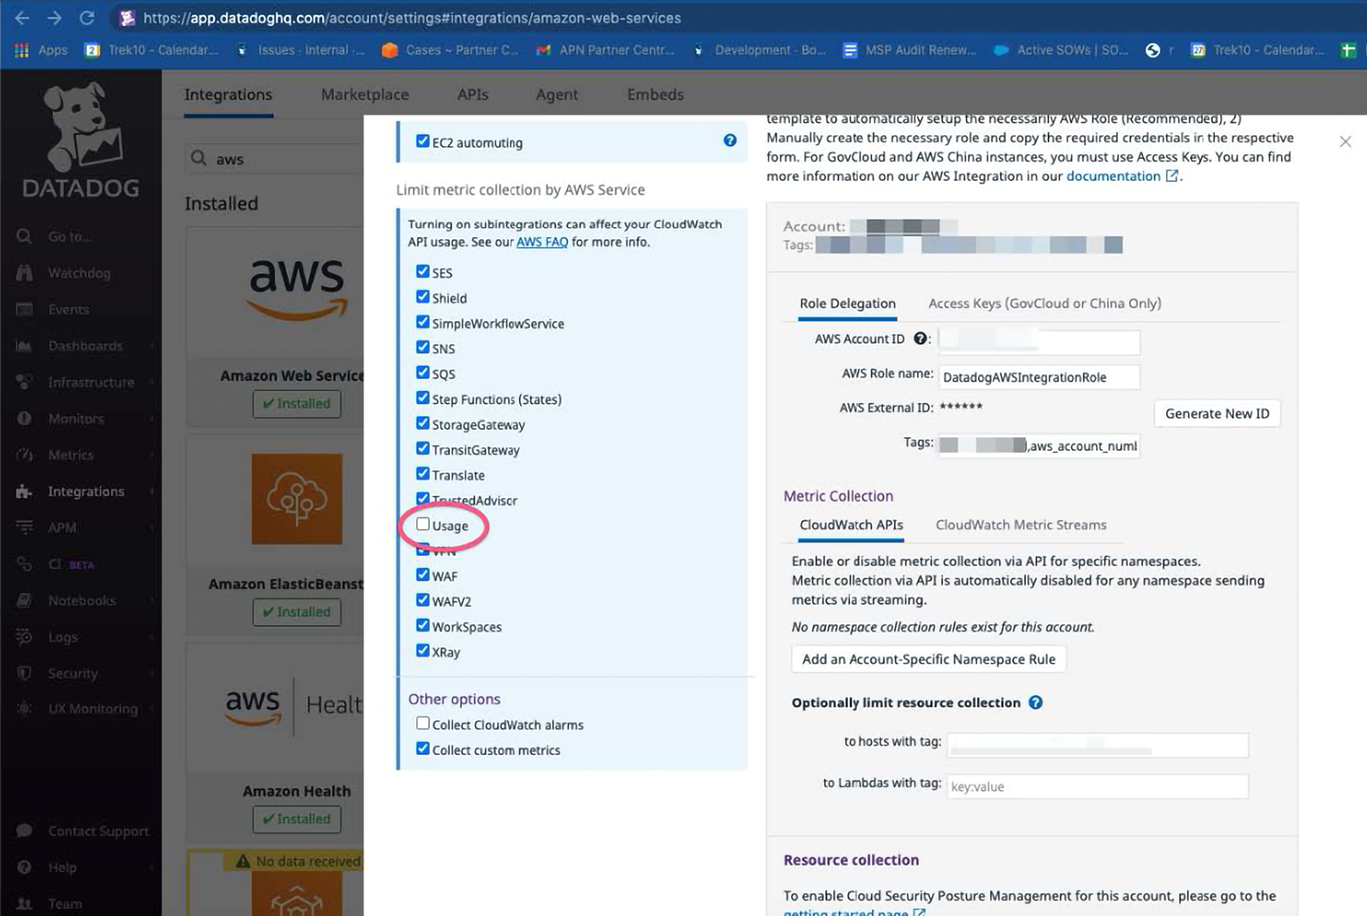
Next, head over to your monitoring tool (if using Datadog specifically head here: https://app.datadoghq.com/account/settings#integrations/amazon-web-services). What you will want to do is remove/uncheck any AWS service that you are not actively monitoring or dashboarding (see pic below). Reducing the number of services Datadog has to get metrics for when reaching out to AWS reduces the # of API calls, which reduces your bill. Furthermore, you can open a ticket with Datadog and ask how often Datadog reaches out to your AWS account (they have different settings such as every 5 minutes, every 10, etc). If you want, you can ask Datadog to reduce how often they reach out to your AWS account (but remember that this will mean your data in the account is updated less frequently).
Hopefully, these tips and tricks have helped you reduce your AWS bill. If you have a specific service that's causing you a pain that I didn't cover please let me know with an email at jbowyer@trek10.com and I will add it to an updated post sometime in the future. If you're interested in more timely help, reach out to info@trek10.com so we can connect you with an engineer to help look at your bill.

How to synthesize an (almost) identical payload using Amazon EventBridge rules.