Spotlight
How to Use IPv6 With AWS Services That Don't Support It
Build an IPv6-to-IPv4 proxy using CloudFront to enable connectivity with IPv4-only AWS services.


Note: The complete code for the examples referenced in this article can be found on Github.
If you’re like me, you are always trying to find ways to make life easier. I am constantly automating things around the house or trying new tips and tricks to improve my daily life. The same can be said about building software. AWS Lambda makes it incredibly easy to run code without thinking about servers, allowing developers to focus on what they do best - code. Developers love building serverless applications with AWS Lambda because it offers greater scalability, quicker time to release, and more flexibility, all at reduced costs.
However, AWS Lambda and serverless applications are not without flaws and introduce new challenges and complexity. Challenges such as debugging, tracing, and developing for retries and failures must be solved differently than traditional applications, often with custom code. These problems aren’t always trivial to solve. Lambda functions can quickly become bloated with boilerplate code, muddying up core business logic. What if there was an easy way to overcome these challenges and improve the developer experience?
AWS Lambda Powertools is an open-source library providing a collection of utilities for AWS Lambda functions designed to make developers’ lives easier. The collection of utilities focuses on implementing best practices such as structured logging, custom metrics, tracing, and more, as defined in the AWS Well-Architected Serverless Lens. Think of each utility as a “power-up” for Lambda, adding a unique ability to help solve distinct challenges found in serverless applications. Developers can choose the utilities they need to follow serverless best practices while avoiding creating and maintaining custom code. AWS Lambda Powertools supports the three most popular Lambda runtimes - Python, Java, and now Node.js, with the official general availability release of AWS Lambda Powertools for TypeScript.
Think of each utility as a “power-up” for Lambda, adding a unique ability to help solve distinct challenges found in serverless applications.
Don’t let the name AWS Lambda Powertools for TypeScript mislead you. This library has been developed for the Lambda Node.js runtime. Therefore, it is compatible with Lambda functions developed with either TypeScript or JavaScript! Currently, AWS Lambda Powertools for TypeScript comes with the core Logger, Tracer, and Metrics utilities, focusing on implementing best practices outlined in the Operational Excellence Pillar. In addition, the TypeScript version will receive the same features as the Python and Java versions in subsequent releases, as seen in the roadmap.
Let’s “power-up” a sample application using AWS Lambda Powertools for TypeScript by walking through how to use each utility. I modified the sample application used in the AWS TypeScript CDK Workshop to show how easy it is to incorporate AWS Lambda Powertools into an existing application. In addition, since the official documentation only has examples in TypeScript, I provided a JavaScript example for those unfamiliar with TypeScript. The complete code for these examples can be found on Github.
Before focusing on each utility, I want to highlight Middy, an open-source Node.js middleware library for AWS Lambda. AWS Lambda Powertools for TypeScript has built-in support for Middy to reduce the manual setup required for some features. Since Middy works with TypeScript and JavaScript, the utility instrumentation will be the same for both languages. Middy can also be used outside AWS Lambda Powertools for TypeScript to create custom middleware for other use cases. Each example below will use the Middy implementation to set up each utility.
The Logger utility provides an opinionated logger to standardize the output with operational information structured as JSON. It can also capture keys from the Lambda context and allows custom keys to be logged at any time to answer questions about the application’s state. Centralized and structured logging is a crucial best practice in serverless applications. Centralized logging helps you search and analyze your serverless application logs. Structured logging makes it easier to build queries to help with debugging.
TypeScript
// import Logger and injectLambdaContext middleware to auto-capture and log the Lambda Context
import { Logger, injectLambdaContext } from '@aws-lambda-powertools/logger';
// import middy (required for injectLambdaContext to automatically inject the Lambda context into the logs)
import middy from '@middy/core';
// import Lambda Context Type
import { Context } from 'aws-lambda';

// create Powertools Logger instance with custom service name
const logger = new Logger();

const lambdaHandler = async (event: any, context: Context): Promise<unknown> => {
  // Old way of logging
  console.log('Incoming Request:', { event });
  // New way of logging using Powertools Logger
  logger.info('Incoming Request:', { event });

  ...
}

// Use middy to add middleware to the Lambda handler.
// It cleans up the handler and removes the need to add boilerplate code, while also allowing you to add custom middleware if needed.
export const handler = middy(lambdaHandler).use(injectLambdaContext(logger));
JavaScript
// import Logger and injectLambdaContext middleware to auto-capture and log the Lambda Context
const { Logger, injectLambdaContext } = require('@aws-lambda-powertools/logger');
// import middy (required for injectLambdaContext to automatically inject the Lambda context into the logs)// import middy (required for injectLambdaContext to automatically inject the Lambda context into the logs)
const middy = require('@middy/core');

// create Powertools Logger instance with custom service name
const logger = new Logger();

const lambdaHandler = async function (event, context) {
  // Old way of logging
  console.log('Incoming Request:', { event });
  // New way of logging using Powertools Logger
  logger.info('Incoming Request:', { event });

  ...
}

// Use middy to add middleware to the Lambda handle
// It cleans up the handler and removes the need to add boilerplate code, while also allowing you to add custom middleware if needed.
const handler = middy(lambdaHandler).use(injectLambdaContext(logger));

module.exports = { handler };
Let’s compare the outputs of console.log() and logger.info().
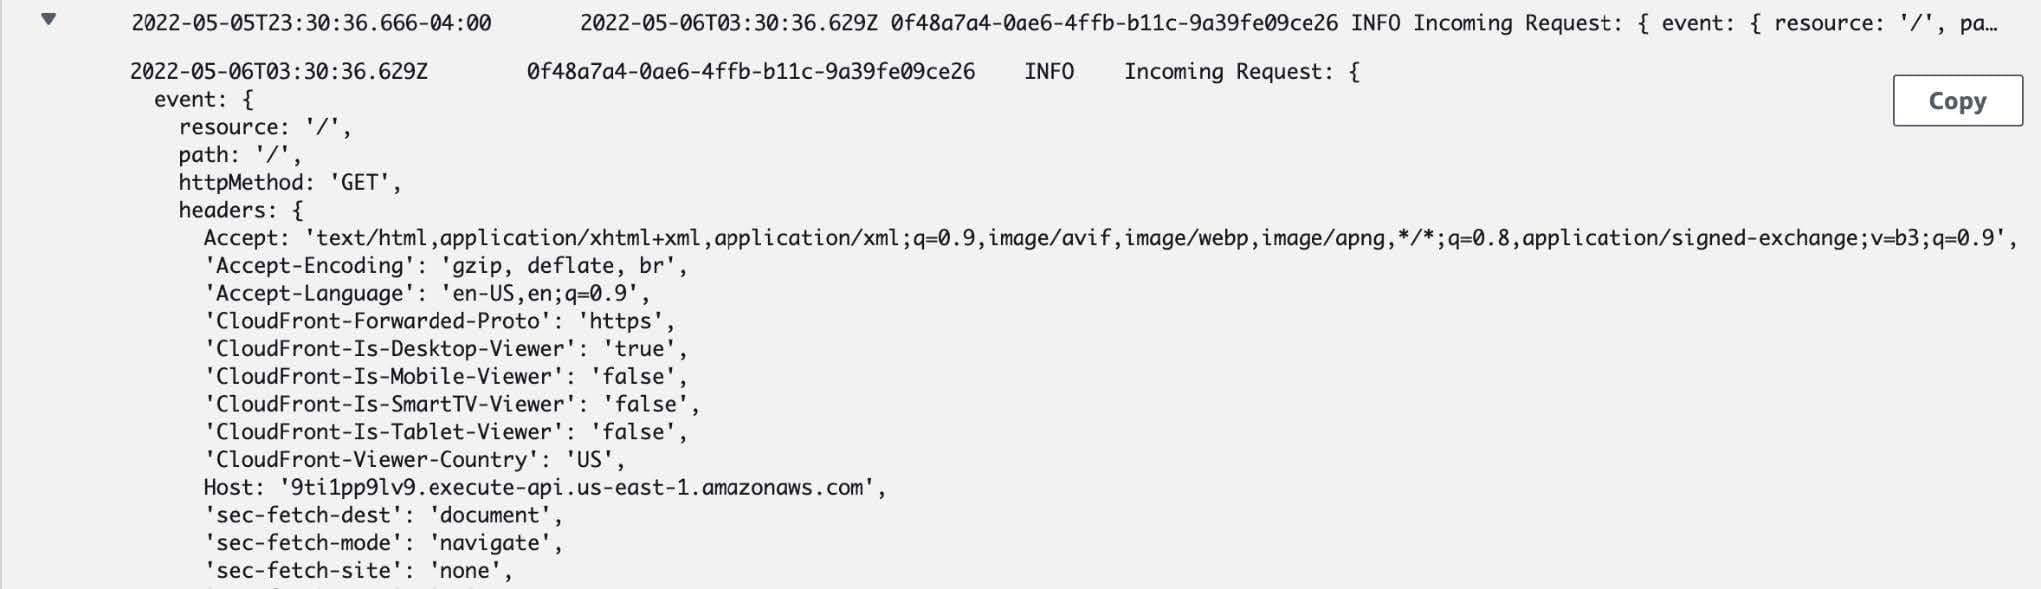
console.log() produces a string output in CloudWatch.
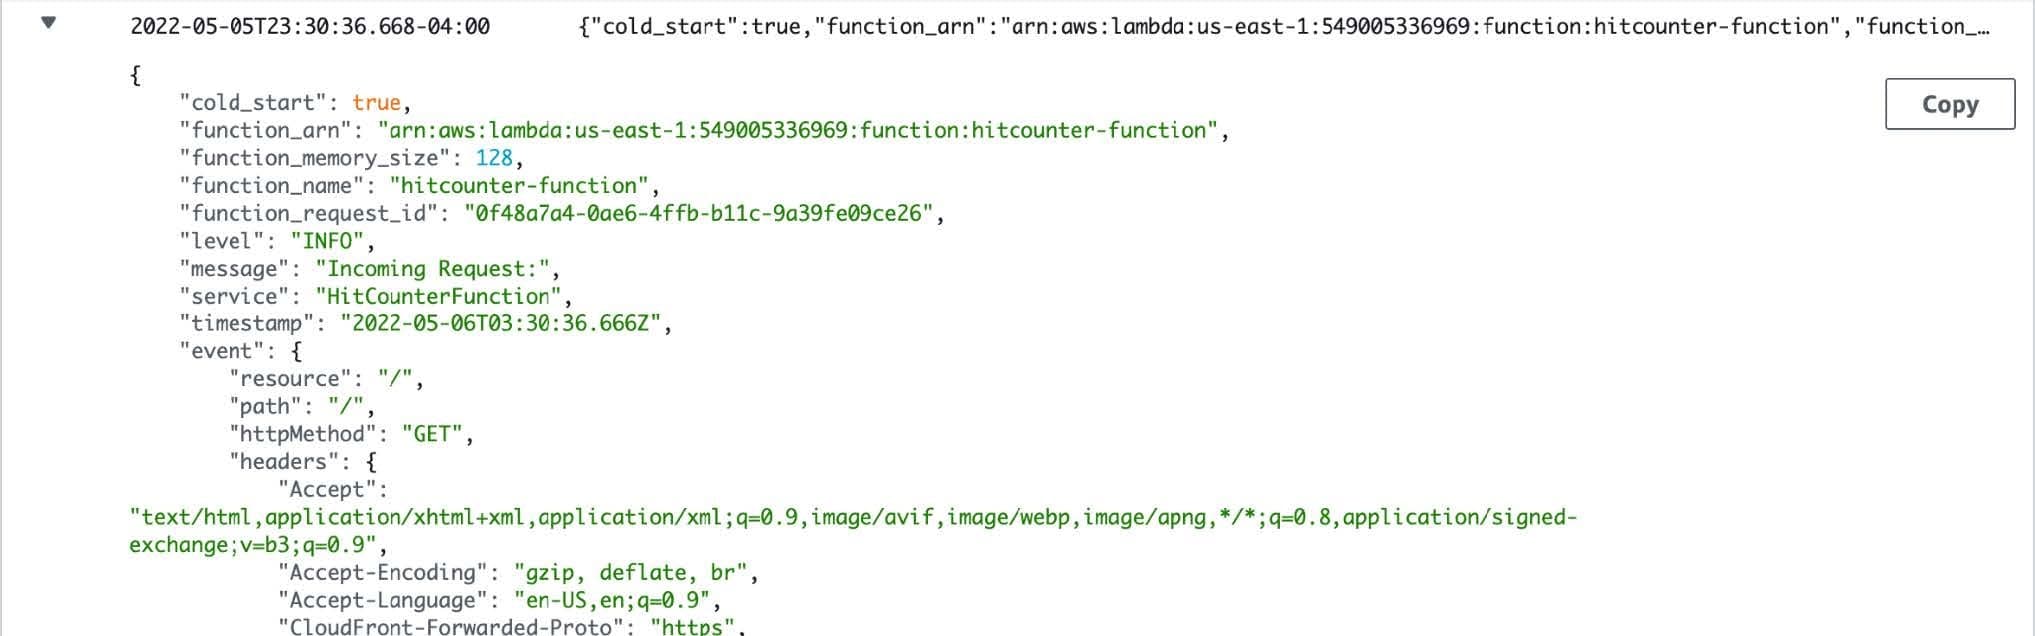
logger.info() produces structured JSON output in CloudWatch.
Using CloudWatch Logs Insights, the structured logs can be easily searched and analyzed to help debug serverless applications.
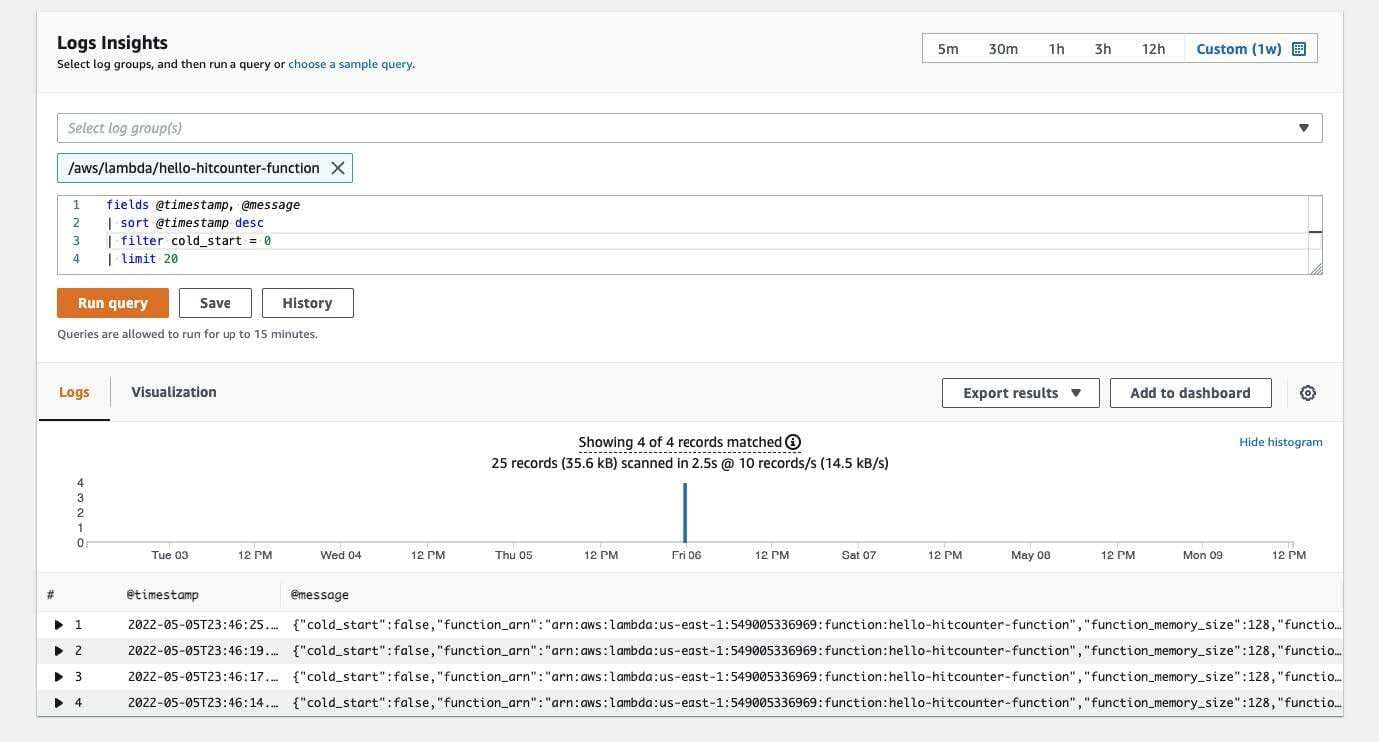
Query structured logs in CloudWatch Logs Insights.
The Logger utility is a simple “power-up” that overhauls logging in Lambda functions. Debugging Lambda functions can be a challenge due to their serverless nature. The Logger utility makes it extremely easy with little to no overhead.
The Tracer utility is an opinionated wrapper around the AWS X-Ray SDK for Node.js, making it easy to adopt distributed tracing. If you want a quick explanation of AWS X-Ray, check out AWS Xray Xplained on Trek10’s CloudProse Blog. The Tracer utility automatically captures cold starts and service names as annotations, providing filtering and searching by a specific service. In addition, it automatically traces HTTP(S) clients and generates subsegments for each request. My favorite benefit of using the Tracer utility is reducing boilerplate code to create subsegments, which cleans up the Lambda handler. I also appreciate having a Service Map of the entire application. This helps visualize the different parts of the application and provides performance insights for faster troubleshooting. Check out the code snippets below to see how to use the Tracer utility.
Note: Ensure “Active Tracing” is turned on for your Lambda function when setting up the Tracer.
TypeScript
// import Tracer utility and middleware
import { Tracer, captureLambdaHandler } from '@aws-lambda-powertools/tracer';
// import AWS clients
import { DynamoDBClient } from '@aws-sdk/client-dynamodb';
import { DynamoDBDocumentClient } from '@aws-sdk/lib-dynamodb';
import { LambdaClient } from '@aws-sdk/client-lambda';
// import Lambda Context Type
import { Context } from 'aws-lambda';
// import middy (required for captureLambdaHandler to automatically create/close subsegments)
import middy from '@middy/core';

// create Powertools Tracer instance
const tracer = new Tracer();

// patch AWS v3 clients to automatically capture AWS service calls
const dynamoDBClient = tracer.captureAWSv3Client(new DynamoDBClient({}));
const dynamoDBDocumentClient = DynamoDBDocumentClient.from(dynamoDBClient);
const lambdaClient = tracer.captureAWSv3Client(new LambdaClient({}));

const lambdaHandler = async (event: any, context: Context): Promise<unknown> => {
  // Optionally add custom annotation for filtering traces
  tracer.putAnnotation('awsRequestId', context.awsRequestId);
  // Optionally add custom metadata for traces
  tracer.putMetadata('eventPayload', event);

  ...
}

// Use middy to add middleware to the Lambda handler.
// It cleans up the handler and removes the need to add boilerplate code, while also allowing you to add custom middleware if needed.
export const handler = middy(lambdaHandler).use(captureLambdaHandler(tracer));
JavaScript
// import Tracer utility and middleware
const { Tracer, captureLambdaHandler } = require('@aws-lambda-powertools/tracer');
// import AWS clients
const { DynamoDB, Lambda } = require('aws-sdk');
// import middy (required for captureLambdaHandler to automatically create/close subsegments)
const middy = require('@middy/core');

// create Powertools Logger instance
const logger = new Logger();
// create Powertools Tracer instance
const tracer = new Tracer();

// patch AWS v3 clients to automatically capture AWS service calls
const dynamo = tracer.captureAWSClient(new DynamoDB());
const lambda = tracer.captureAWSClient(new Lambda());

const lambdaHandler = async function (event, context) {
  // Optionally add custom annotation for filtering traces
  tracer.putAnnotation('awsRequestId', context.awsRequestId);
  // Optionally add custom metadata for traces
  tracer.putMetadata('eventPayload', event);

  ...
}

// Use middy to add middleware to the Lambda handler.
// It cleans up the handler and removes the need to add boilerplate code, while also allowing you to add custom middleware if needed.
const handler = middy(lambdaHandler).use(captureLambdaHandler(tracer));

module.exports = { handler };
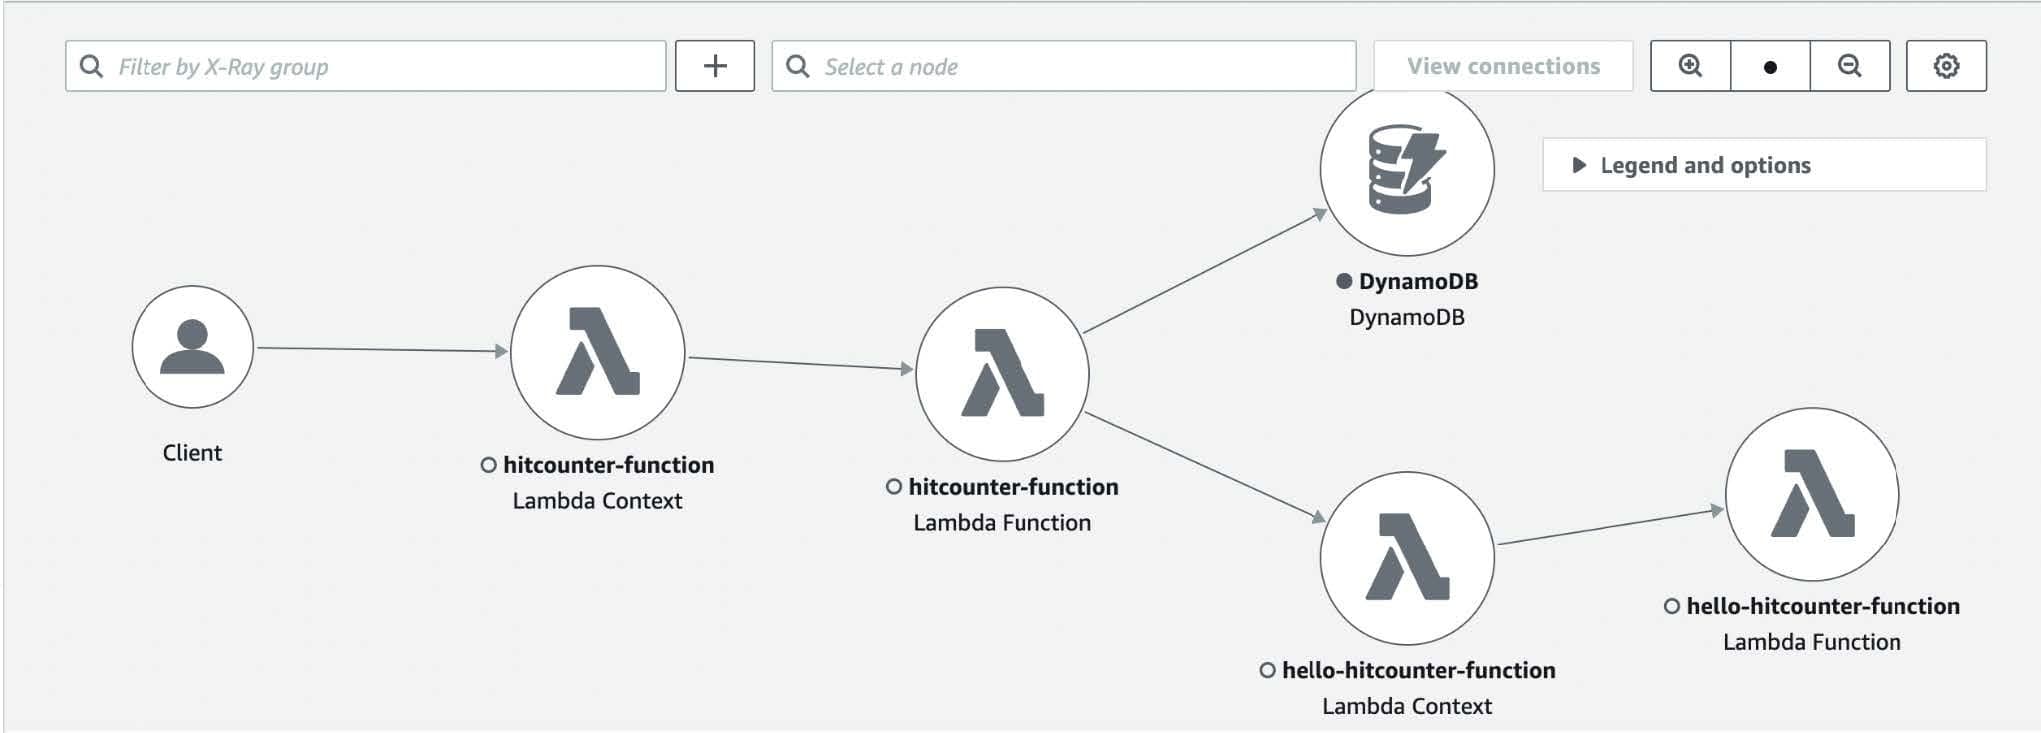
AWS X-Ray Service Map of the entire application when implemented with Tracer.
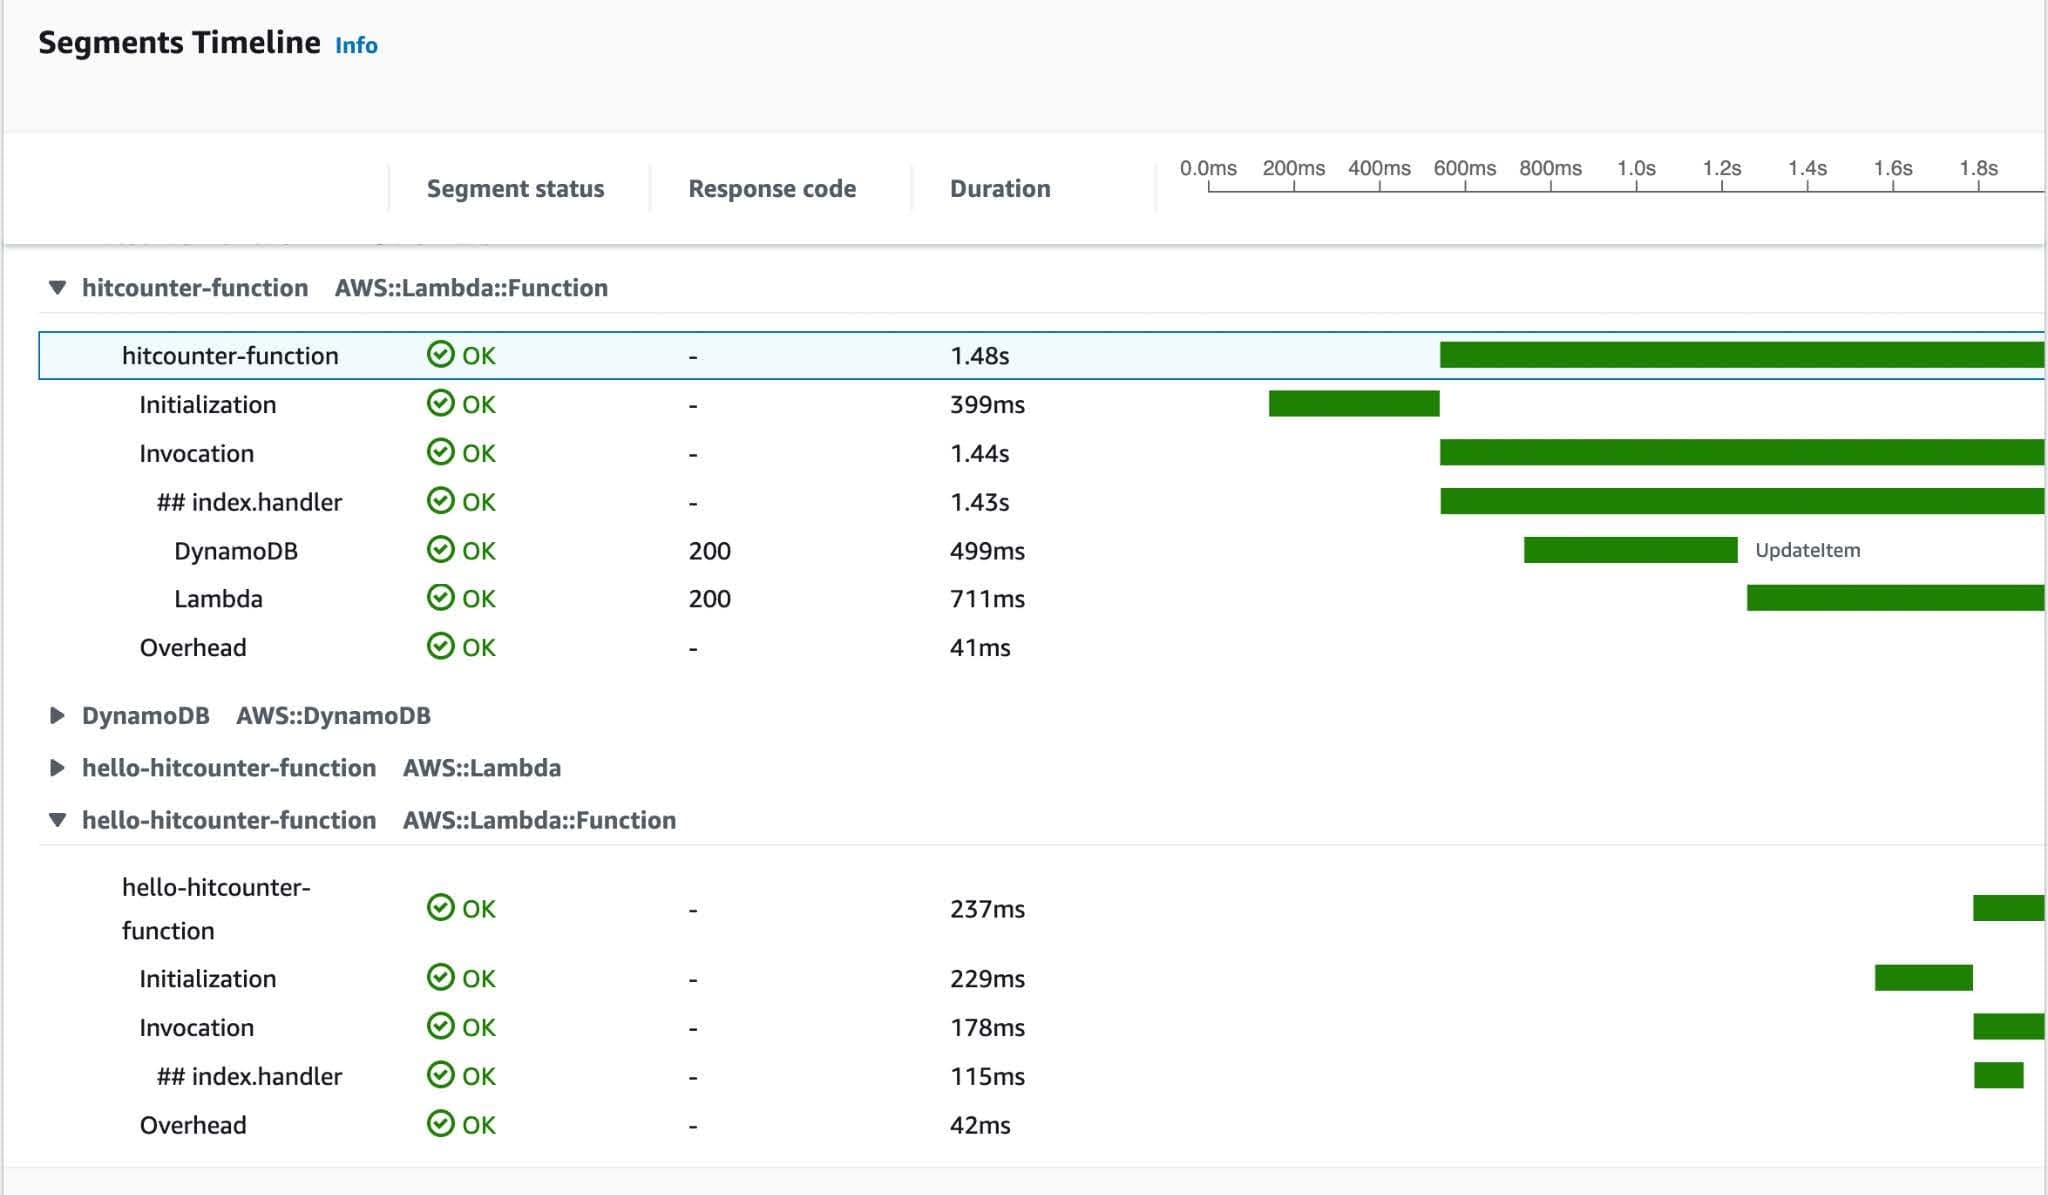
Automatically generated subsegments under the function invocation traces.
The Tracer utility is a great “power-up” to add distributed tracing to your Lambda functions to gain insights into performance degradation or network anomalies. It becomes even more powerful when coupled with structured logs from the Logger utility to improve the troubleshooting experience.
The Metrics utility creates custom CloudWatch metrics by logging metrics to standard output following Amazon CloudWatch Embedded Metric Format (EMF). The metrics are then asynchronously uploaded to CloudWatch without affecting the performance of the serverless application. Potential use cases for gathering metrics are tracking the number of orders placed or the average time it takes to check out in an online store. The metrics can then be visualized in a dashboard in CloudWatch around these specific business goals.
TypeScript
// import Metrics utility and logMetrics middleware to capture cold start metrics
import { Metrics, MetricUnits, logMetrics } from '@aws-lambda-powertools/metrics';
// import middy (required for captureColdStartMetric to automatically capture cold start metrics)
import middy from '@middy/core';
// import Lambda Context Type
import { Context } from 'aws-lambda';

// create Powertools Metrics instance
const metrics = new Metrics();

const lambdaHandler = async (event: any, context: Context): Promise<unknown> => {
  // Optionally create a custom metric
  metrics.addMetric('hit', MetricUnits.Count, 1);
  metrics.publishStoredMetrics();

  ...
}

// Use middy to add middleware to the Lambda handler
// It cleans up the handler and removes the need to add boilerplate code, while also allowing you to add custom middleware if needed.
export const handler = middy(lambdaHandler)
  .use(
    logMetrics(metrics, {
      captureColdStartMetric: true
    })
  );
JavaScript
// import Metrics utility and middleware
const { Metrics, MetricUnits, logMetrics } = require('@aws-lambda-powertools/metrics');
// import middy (required for captureColdStartMetric to automatically capture cold start metrics)
const middy = require('@middy/core');

// create Powertools Metrics instance
const metrics = new Metrics();

const lambdaHandler = async function (event, context) {
  // Optionally create a custom metric
  metrics.addMetric('hit', MetricUnits.Count, 1);
  metrics.publishStoredMetrics();

  ...
}

// Use middy to add middleware to the Lambda handler.
// It cleans up the handler and removes the need to add boilerplate code, while also allowing you to add custom middleware if needed.
const handler = middy(lambdaHandler)
  .use(
    logMetrics(metrics, {
      captureColdStartMetric: true
    })
  );

module.exports = { handler }
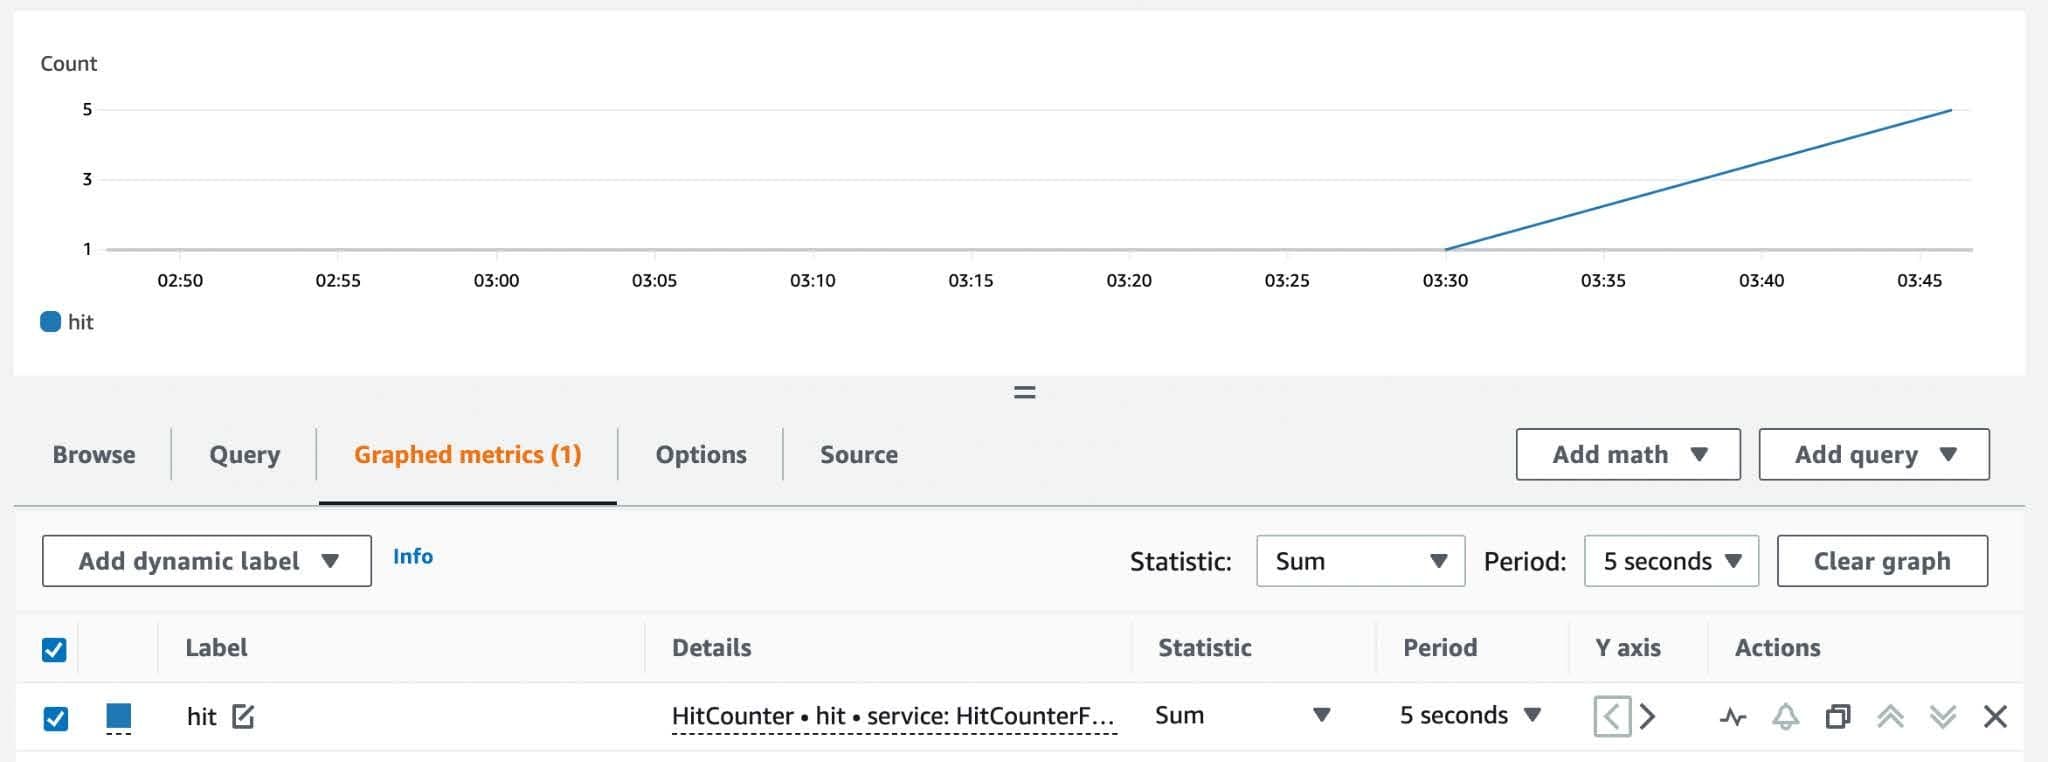
Create dashboards in the console using custom metrics from your application.
The Metrics utility is the perfect “power-up” to make it easy to adopt metrics best practices by simplifying the creation and collection of custom metrics without developing and maintaining custom logic.
AWS fully maintains this project and has a large active community for developers to get support or request additional features. For example, there is a feature request for adding support for other observability providers like New Relic and Datadog. Lambda Powertools for TypeScript currently focuses on improving observability in serverless applications using Amazon CloudWatch and AWS X-Ray. At Trek10, we heavily use Datadog, so I’m hoping this feature will eventually make its way into a subsequent release! I’ve already added the Logger and Tracer utilities to my existing Node.js Lambda functions, significantly improving observability and making debugging easier. I love how simple AWS Lambda Powertools makes it to adopt best practices and follow the AWS Well-Architected Framework when building serverless applications.

Build an IPv6-to-IPv4 proxy using CloudFront to enable connectivity with IPv4-only AWS services.