Spotlight
How to Use IPv6 With AWS Services That Don't Support It
Build an IPv6-to-IPv4 proxy using CloudFront to enable connectivity with IPv4-only AWS services.

Better understand your serverless workloads on AWS with X-Ray
If you’re like me, AWS X-Ray is a service you’ll learn about when you’re studying for your AWS Certified Solutions Architect Associate certification and you only get a very high level surface understanding of what it is or does, but beyond that you’ll never touch it - that is, until you need it. My goal in this post is to demonstrate the value AWS X-Ray can provide and convince you to use it in all of your serverless (or even containerized and traditional) workloads.
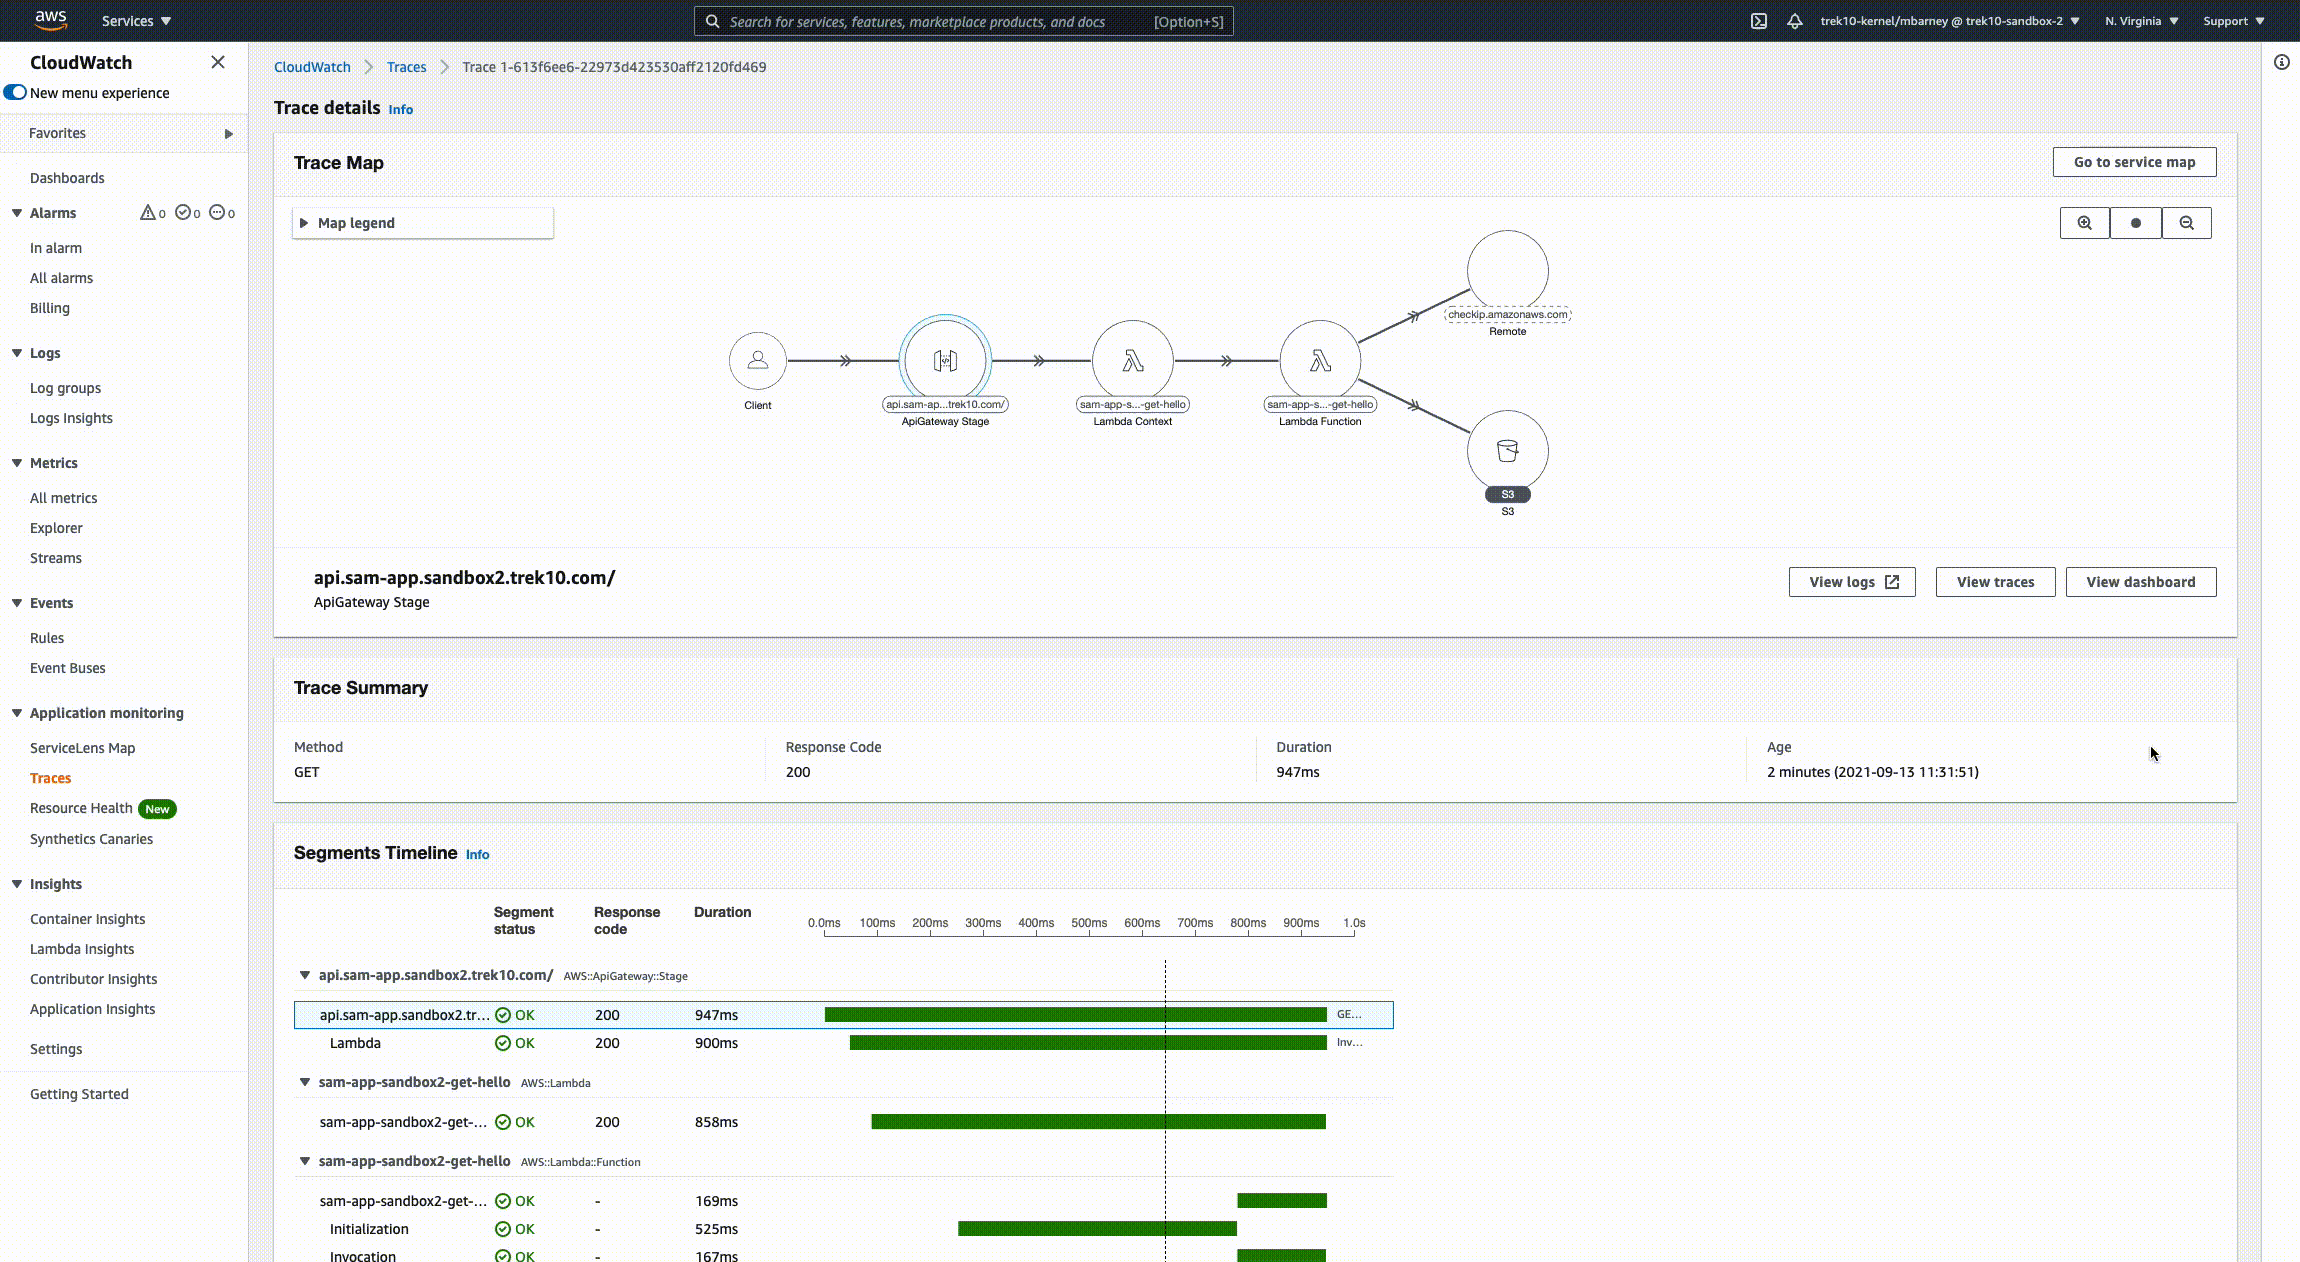
AWS X-Ray was released in 2016 as an observability and distributed application tracing service. If you’re not familiar, it’s a service that can track how a request moves through a system and how it’s affected by the components it passes through. In this post we’ll use a typical serverless application as our example: API Gateway, Lambda, and DynamoDB. The examples we use here are using AWS SAM as our Infrastructure-as-Code tool and NodeJS as our Lambda runtime, but AWS X-Ray works with other language runtimes too, such as Python, Go, and even Ruby.
Data from each component and the request itself is collected and aggregated into a “Trace.” A Trace is identified in AWS X-Ray by a Trace ID, and contains metadata around the origin of the request - such as the URL of a request.
A trace is composed of “segments.” Segments are used by X-Ray to represent a component that might be hit during the handling of a message or request - for instance an API Gateway stage, a Lambda function, or a DynamoDB table. Segments are further broken down into subsegments, which can represent more granular individual detail about the behavior of a component within a trace.
AWS X-Ray is a service that provides more value the more effort you put into it. You can get a pretty basic (but still useful) level of visibility through a couple lines of CloudFormation. For instance, if you add the following to your SAM template:
Globals:
  Api:
    TracingEnabled: True
  Function:
    Tracing: PassThrough
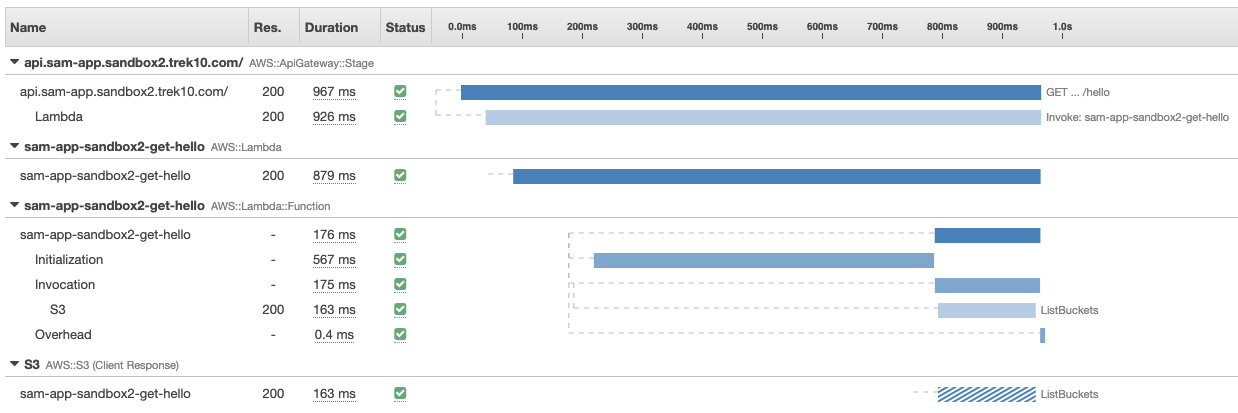
You’ll see X-Ray traces within the AWS X-Ray console that contain Segments around API Gateway and the Lambda service itself. The segments contain information around how long the request took within that given component of your architecture, their status codes, and can even be used to determine things like cold start performance hits. The service map might look something like this:
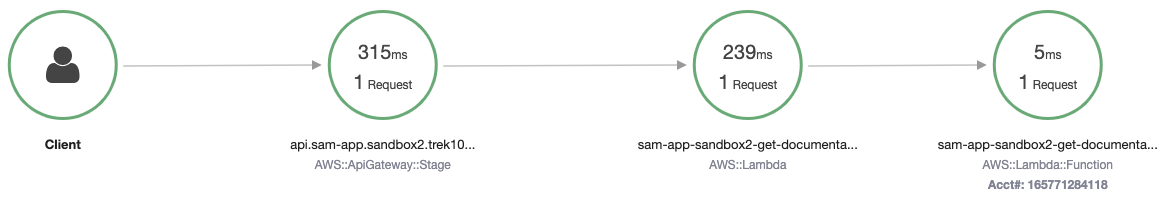
And the trace timeline would look something like this:
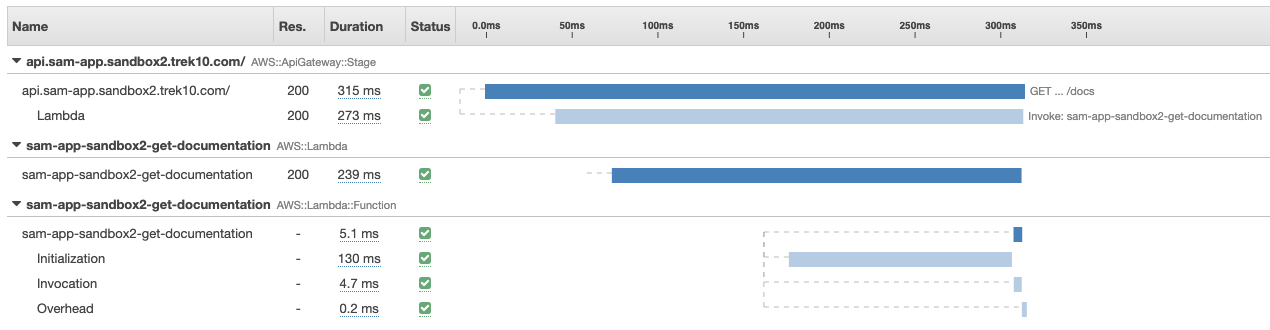
With this basic level of tracing, you’ll be able to see how much a given cold start impacts a request’s performance (see the “Initialization” section of the trace timeline).
But there’s probably more information you’ll want to track about a given request, specifically around how your code is performing, so how can we instrument our code?
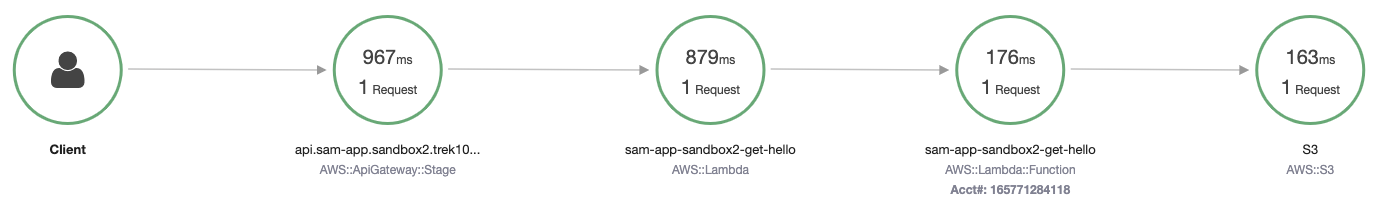
If your backend implementation is making network requests, that’s likely the largest source of latency in your API, so you’ll want to profile it, right? In a cloud native environment, X-Ray is the goto solution for that problem. Let’s say your Node JS code is making an AWS SDK request, for instance to get the number of buckets in a request:
const aws = require('aws-sdk');
const s3 = new aws.S3();
await s3.listBuckets().promise()
The way to instrument this AWS SDK request would be with the aws-xray-sdk-core module:
const xray = require('aws-xray-sdk-core');
const aws = xray.captureAWS(require('aws-sdk'));
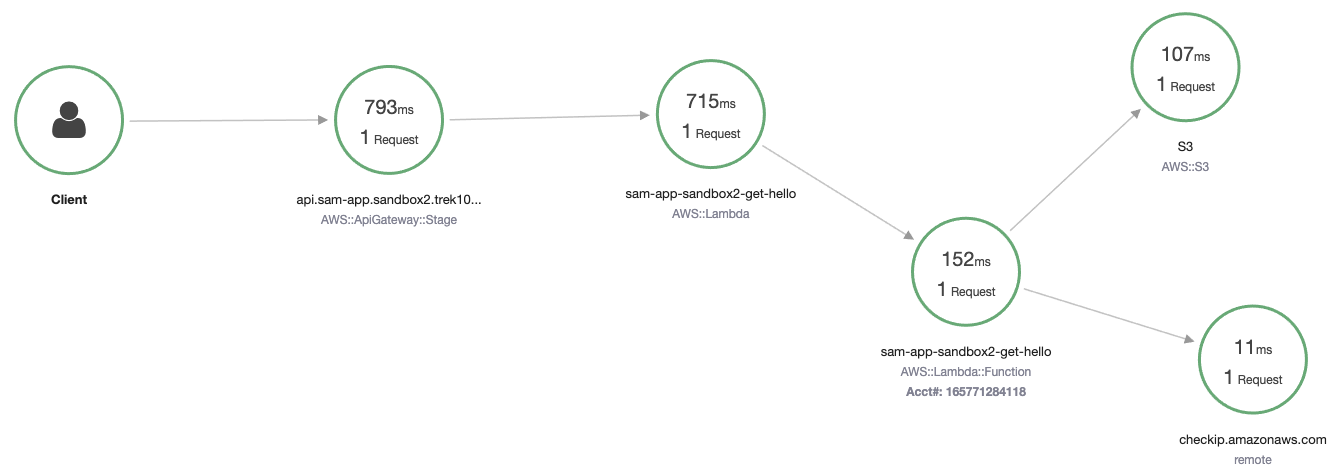
The returned aws object will send trace information to X-Ray for each AWS API called. From here, you’ll see something like this in your service map:
With an S3 subsegment within the trace timeline:
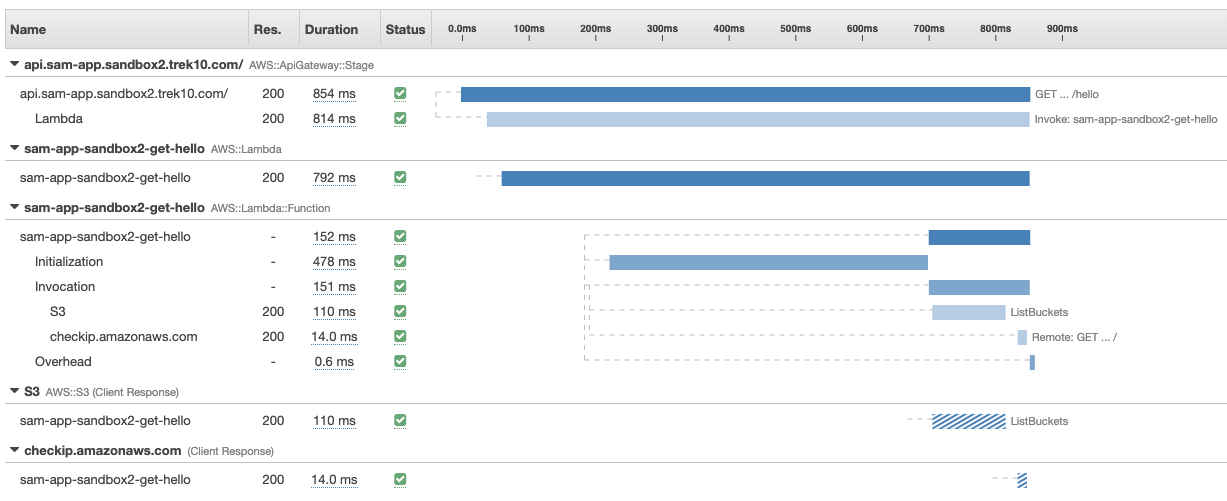
But what about third party HTTP requests? Let’s say you’re making an HTTP request to some third party and want to profile the performance of that third party. The X-Ray sdk makes this possible with the captureHTTPsGlobal method:
xray.captureHTTPsGlobal(require('https'), true);
Now if you’re making any HTTP request within your code, you’ll see a subsegment with some trace information around it:
With a trace timeline that looks like this:
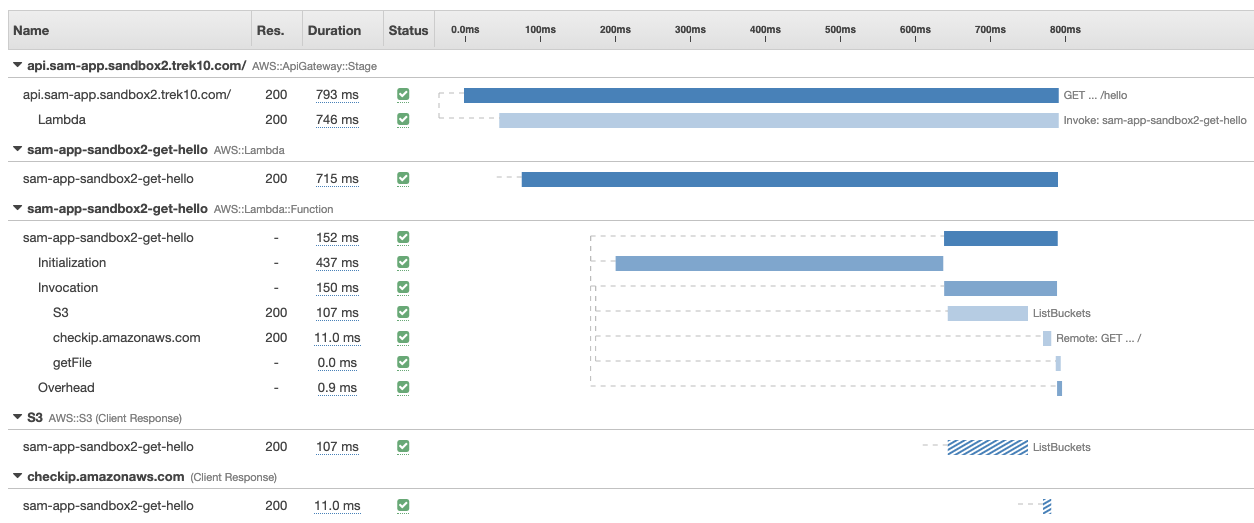
Now let’s say there’s a part of your code that’s doing a ton of processing, and you’d want to profile that too. That’s still possible, but it’s going to take a bit more work than the previous two methods of instrumentation. The X-Ray sdk provides a xray.captureAsyncFunc method that can be used to create subsegements for any piece of code or function (documented here). So if you wrap some piece of functionality using this method, no new segments will be added to your service map, but within the AWS::Lambda::Function segment, you’ll see the function call was instrumented in the trace timeline (in this case we wrapped a function and named the subsegment name “getFile”):
Now that you can profile how your code is running down to the programming language function call, you can use that to better understand how your code is behaving and get further insight into how things could be optimized or even help debug problems within your app. AWS X-Ray is a pretty sweet service and I encourage anyone running workloads on AWS (Serverless, containerized, or traditional) to look into it and give it a shot.
The CloudWatch team released a capability called Service Lens. It basically functions as a superpowered X-Ray console. The UX is polished, and it integrates with things like CloudWatch Logs Insights - aggregating API Gateway logs and Lambda logs together for a given trace, even if you have lambdas calling lambdas, their logs will be visible from one pane.

Build an IPv6-to-IPv4 proxy using CloudFront to enable connectivity with IPv4-only AWS services.