Spotlight
Demoing the Blues Wifi + Cell Communication Module
Explore the Blues Cell + Wifi communication module on a Raspberry Pi Zero, Notehub, and thoughts on the pros and cons of utilizing Blues in your IoT project.


Filtering is an essential component of any exceptional dashboard and plays a very important role in creating visualizations that illustrate your data insights in a compelling way. In QuickSight, filters will serve your visualizations in the most basic way by reducing the volume of the data displayed to a specific condition you set. Most importantly, filters and similar tools will allow your users to choose for themselves how they want to interact with the visualizations that you present them. Mastering this tool will not only empower your user to discover more insights that your dashboard has to offer but allow users to conduct their own analysis through your visuals.
QuickSight allows you to leverage the power of filters to different degrees. The following post will cover all the possible ways to use dashboard filtering through the tools including:
Finally, we will complement the explanation by applying all of this to a practical example.
As mentioned, filters are the most basic implementation of reducing the data in your visuals to a range of values you want to display. The Filter pane in the left panel of the analysis can be considered the homepage for filters. To apply a filter, you simply click on Add Filter for the field you want to filter.
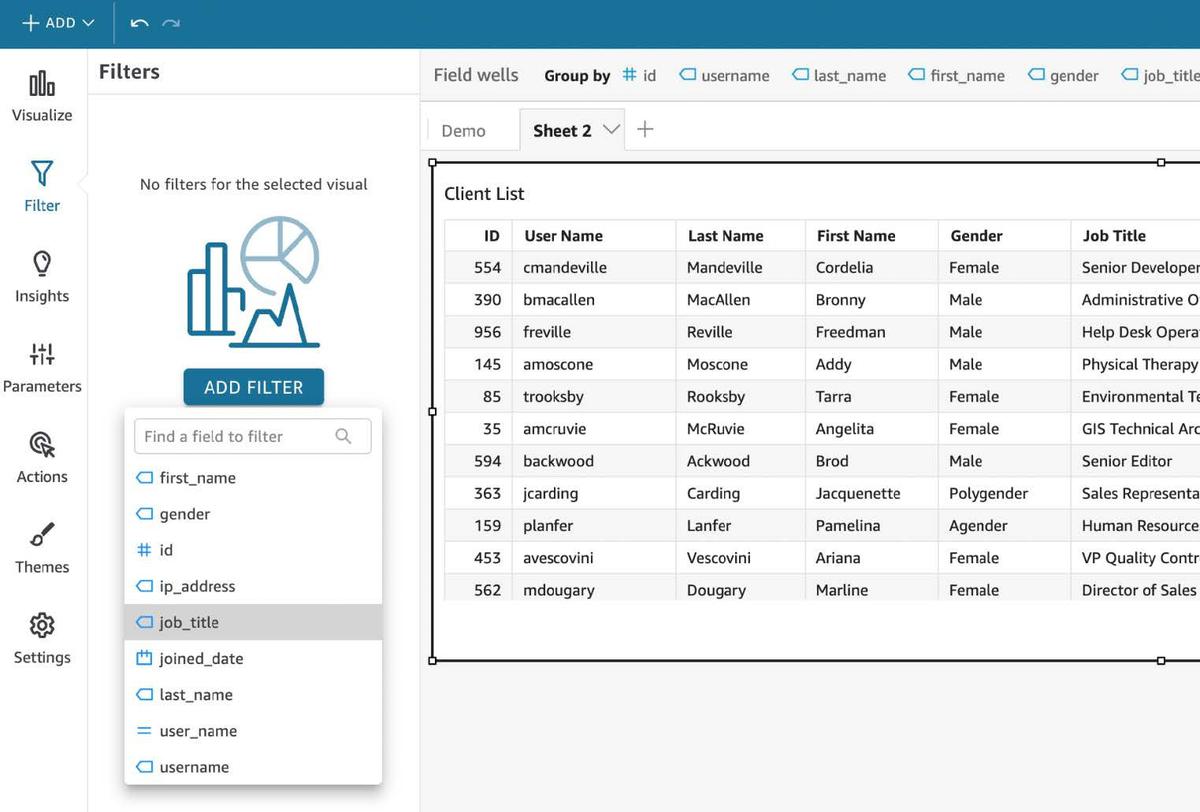
Example: Filtering gender to include all genders except male and female.
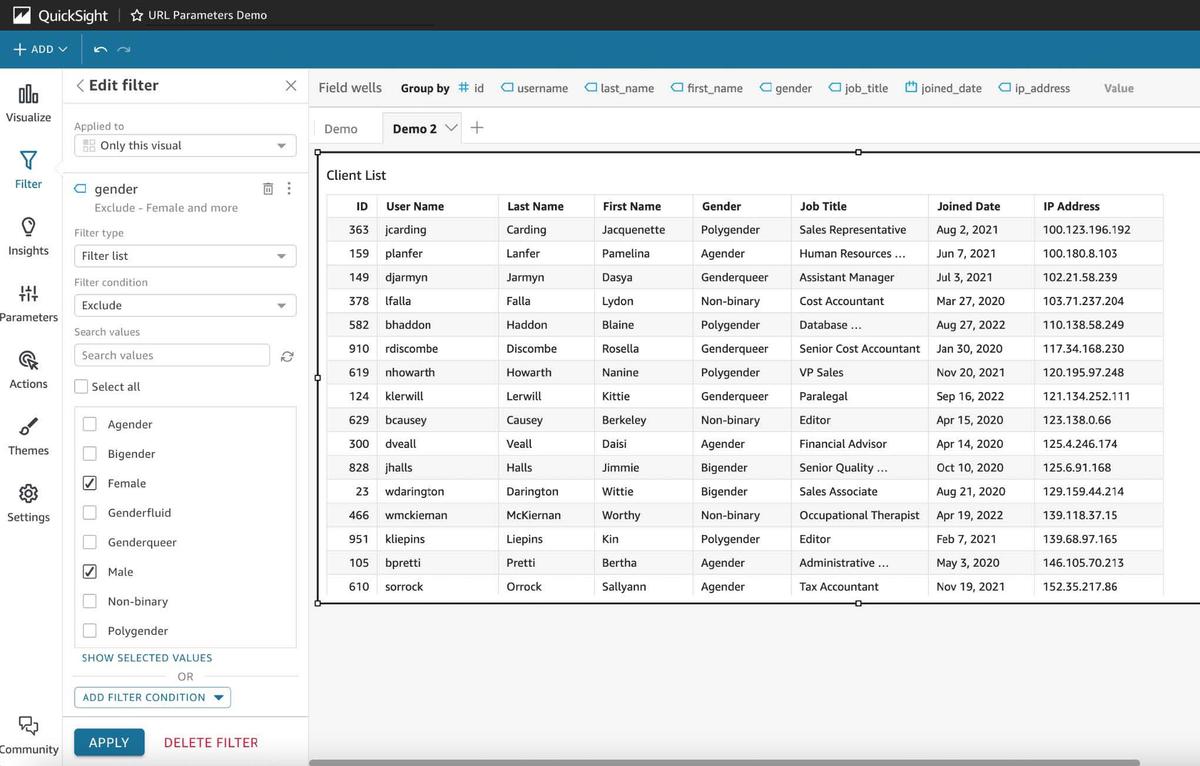
Visual selection is very important when creating and applying filters. In the example above, the filter for gender is only applied to the Client List visual since it was the one that was selected upon creation.
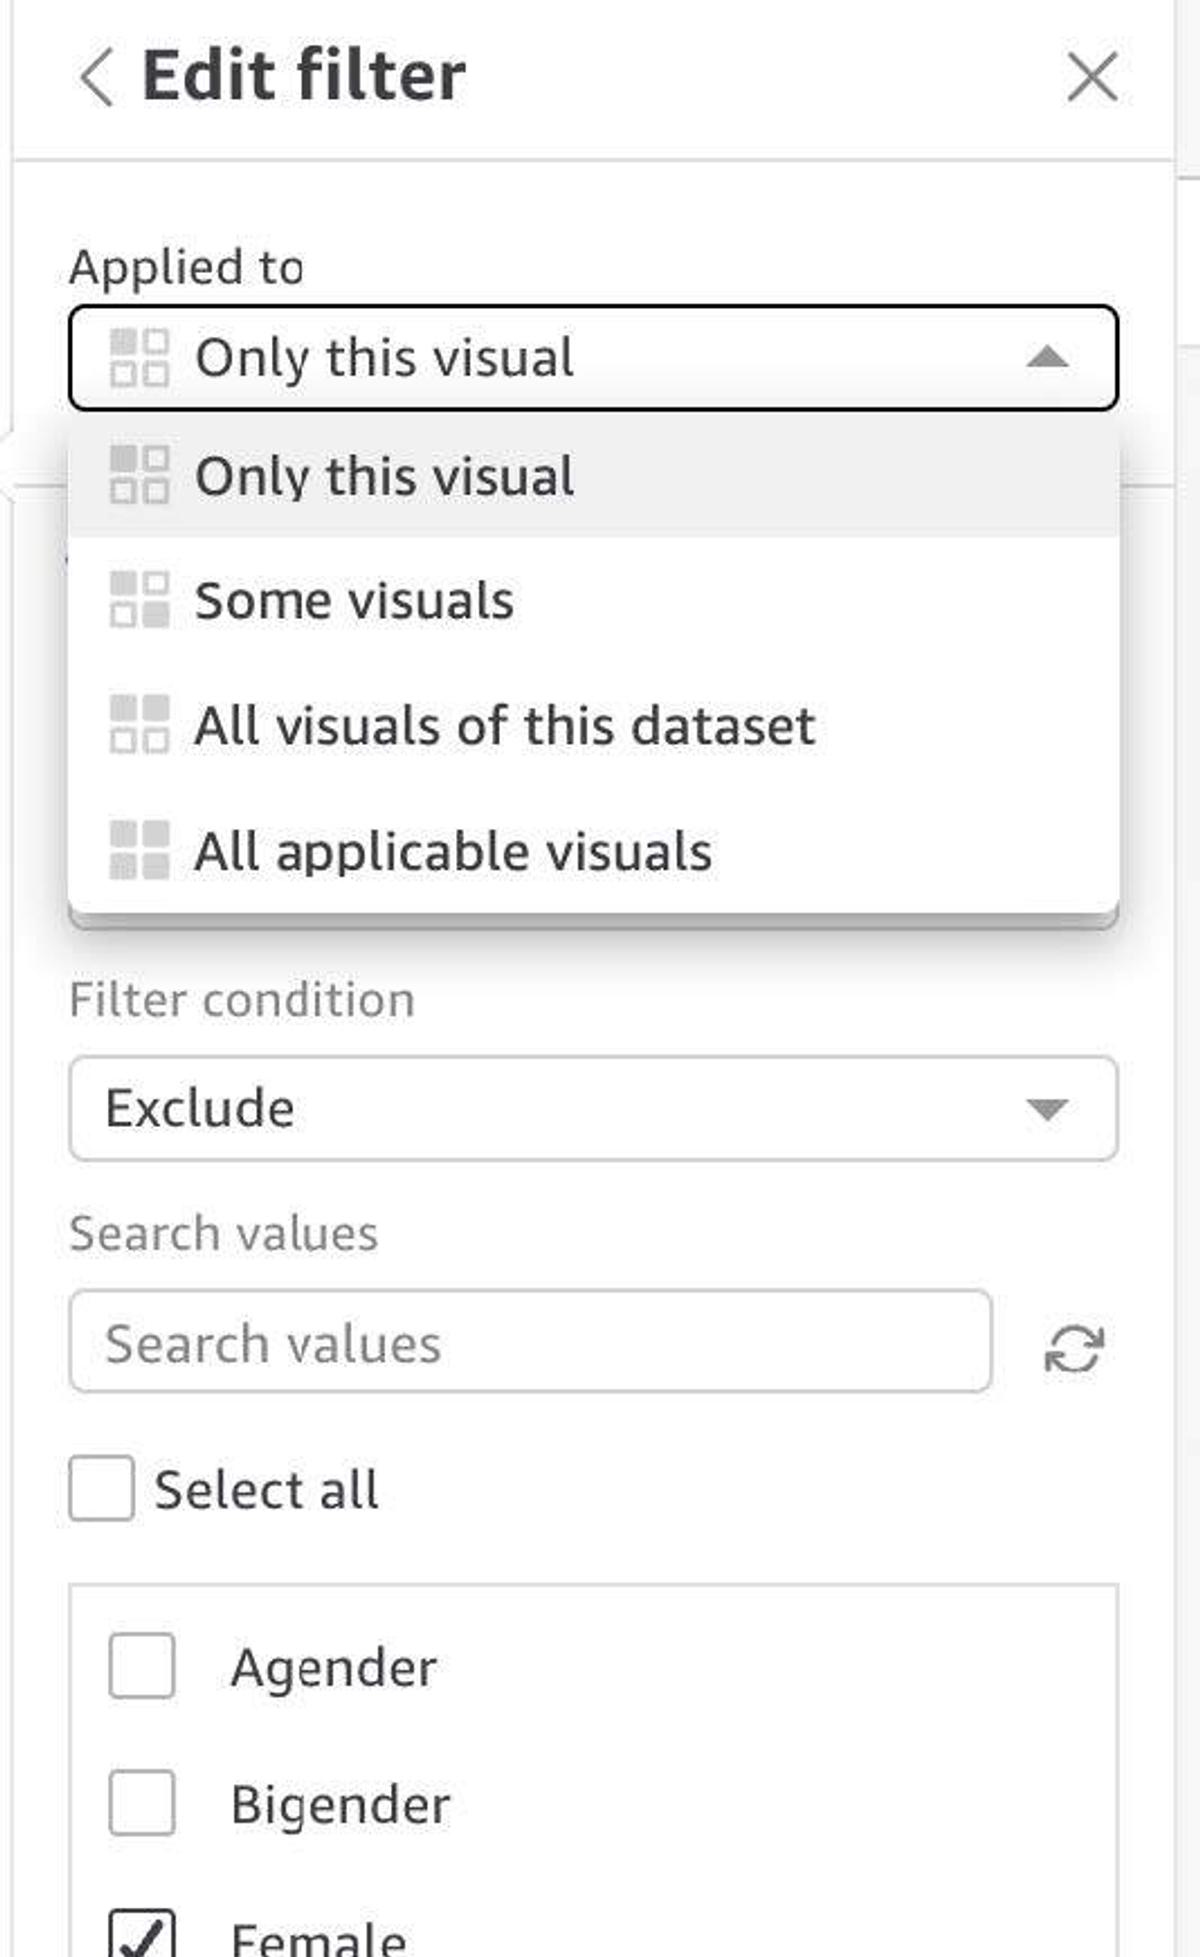
During or after creating the visual, we have the option to apply this filter to multiple visuals. In the Edit filter pane, the Applied to section allows you to apply it to:
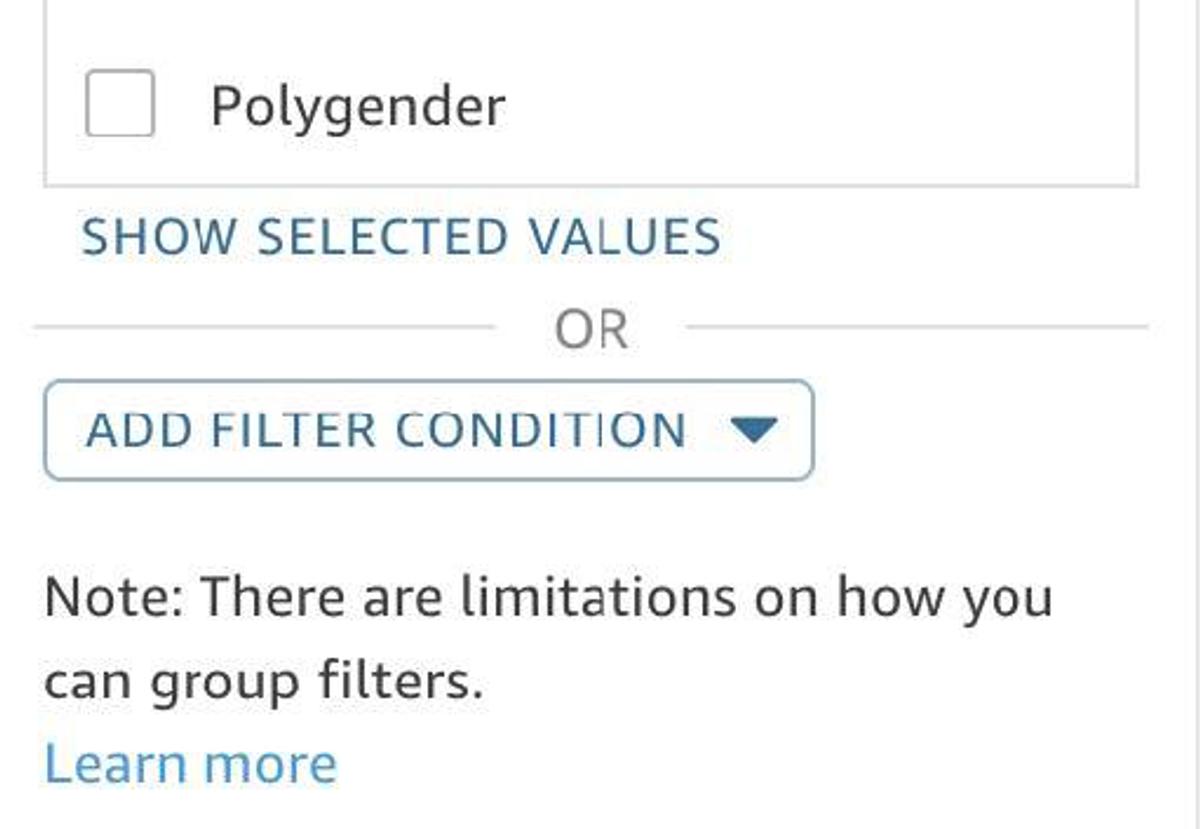
Some final considerations on the filter theory in QuickSight are:
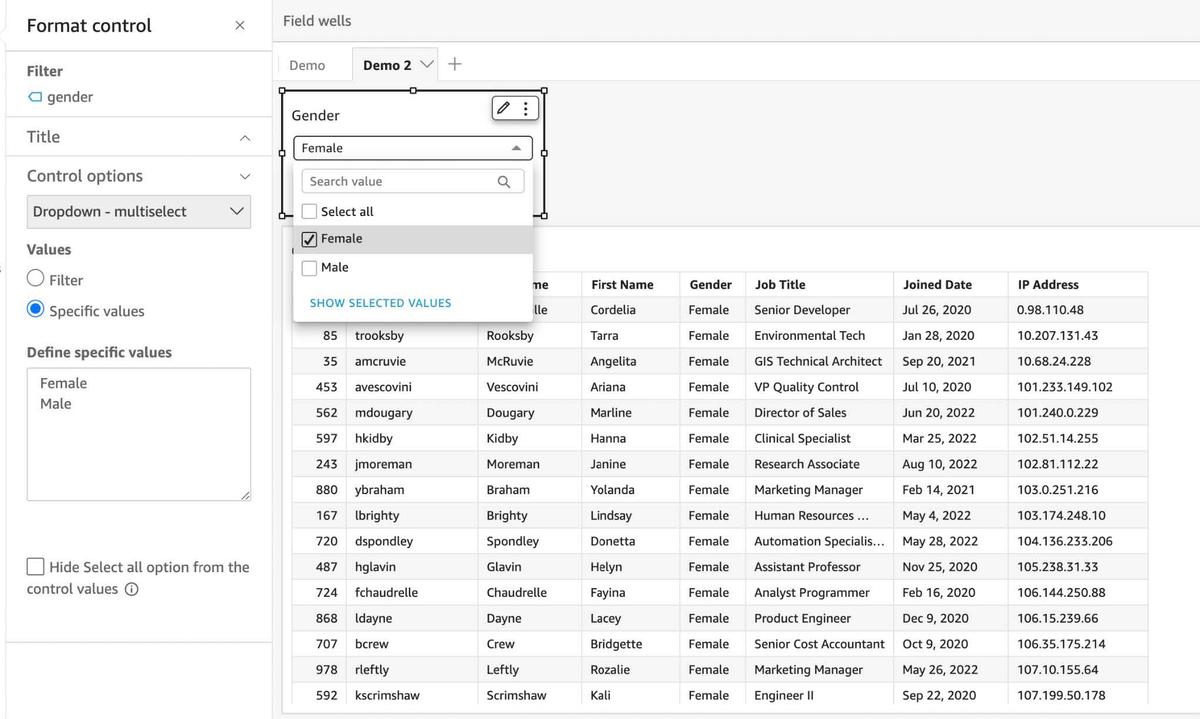
Filter controls are what make your dashboards’ interactive capabilities come to life. Filter controls allow you to add the filters that you have created for your visual (or multiple visuals) to the sheet so that your users can select how they want the filter to be applied. You control WHERE the filter applies to but the users select WHAT the filter is.
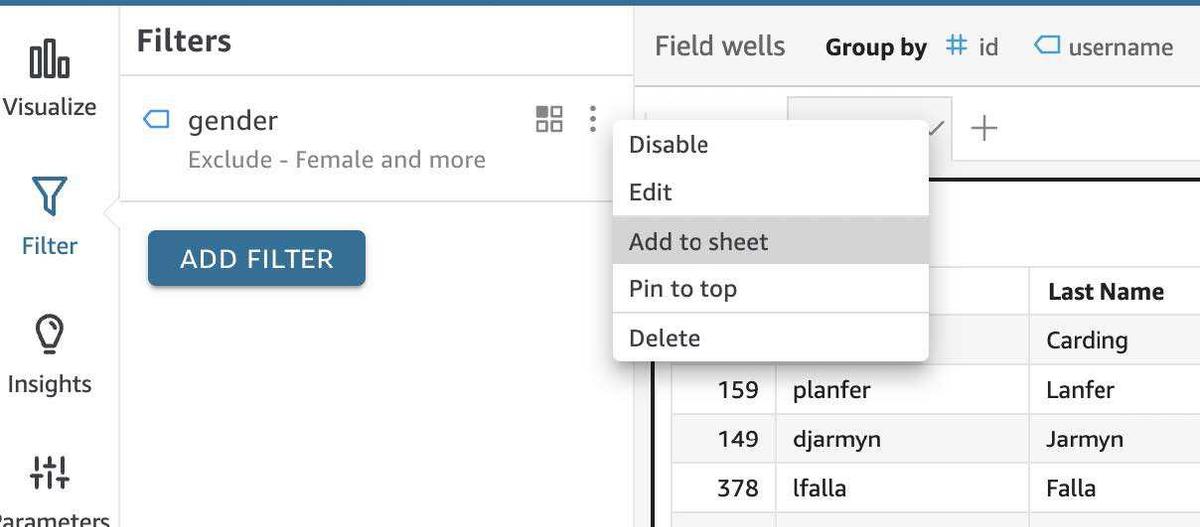
Your two options for filter controls are:
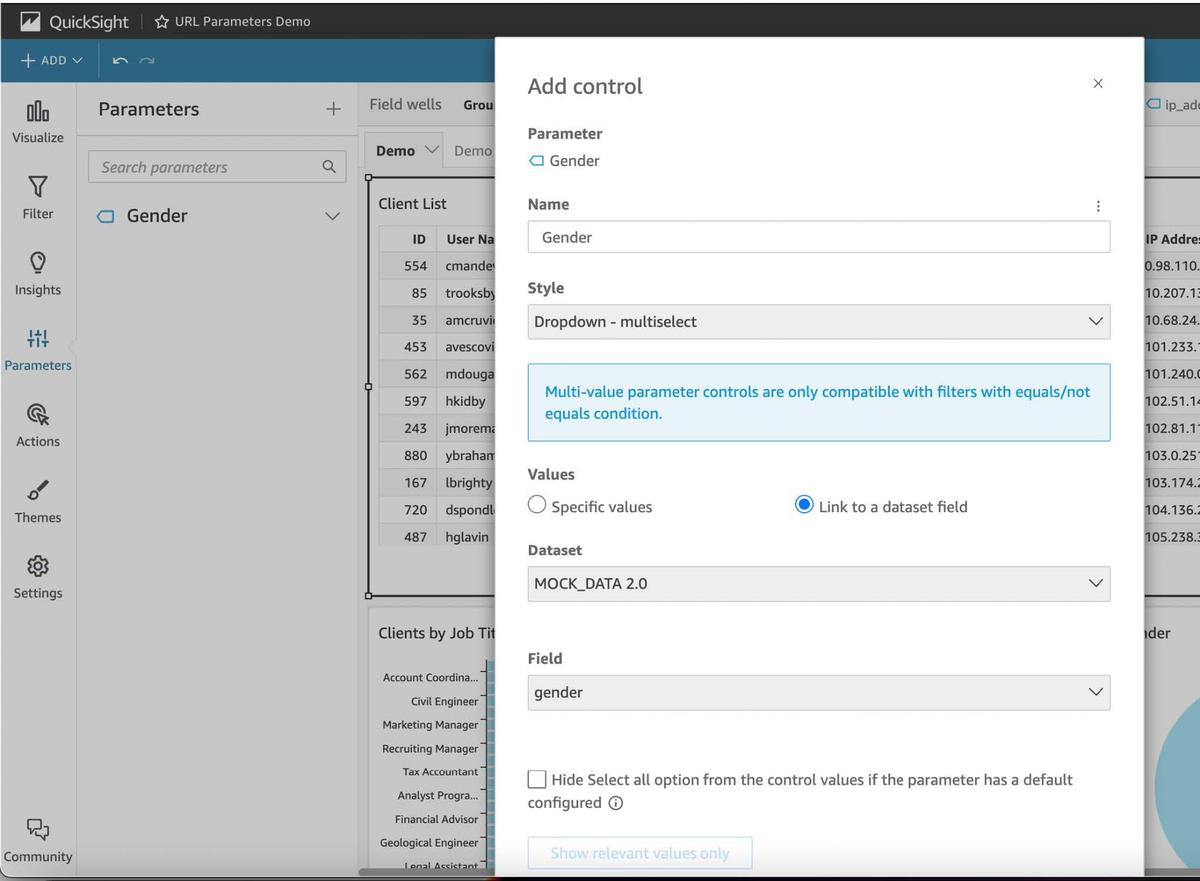
Regardless of what option you choose, you can use the edit filter menu (pencil icon) to control the location. A very important consideration when you convert filters to filter controls is that you can customize how users can manage the filter by configuring Control options. Control options are found in the previously mentioned filter menu. The data type will determine what control options you can implement, similar to the options you are given in filter types when you are creating the filter. For example, text field filters can be customized to be a Dropdown - multi-select, where the user can pick what distinct values to include in the visuals. However, if you customize the control as a List, this reduces the options for your user to a single value among all distinct values available to be chosen. As mentioned in the filter types section above, the ability to customize is lengthy and diverse across data types. You can find your options for customizing control options here.
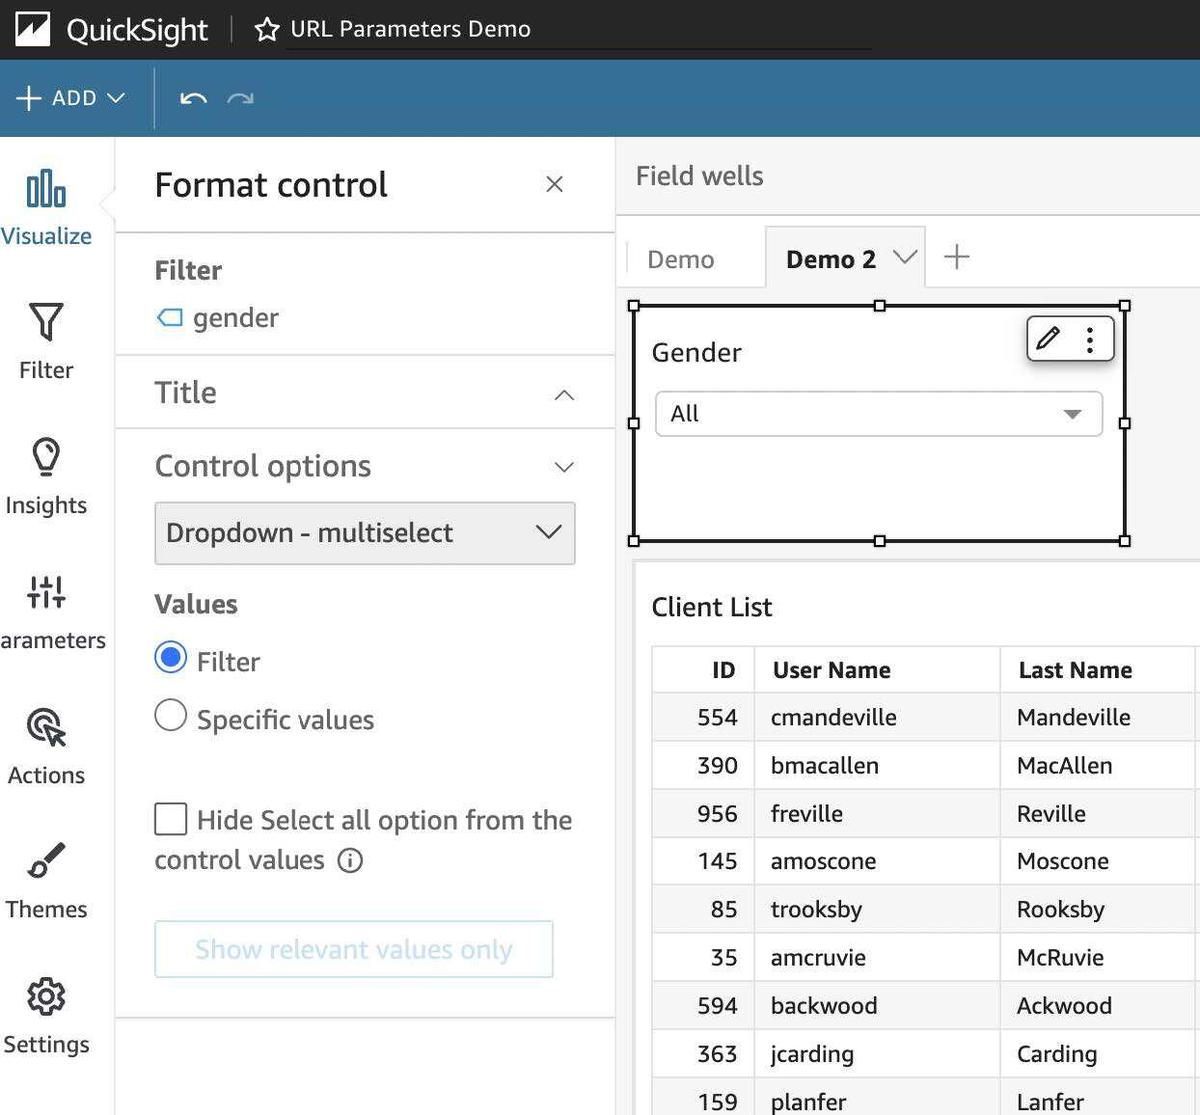
Once you have chosen what filter type you are using, note that you have two options: Filter and Specific values. The filter option will include ALL distinct values that QuickSight finds in that field. Specific values allow you to list what values the user will see in the filter that gets added to the visual. In the example, listing Female and Male will mean that unless the user selection is Select all, the user will automatically filter out the rest of genders.
Custom actions are another useful tool to enhance the interactive capabilities of your dashboard for your user. AWS documentation on custom actions mentions that adding them to your dashboards “can make it easier to drill into the details and to find new insights in the same dashboard, a different dashboard, or a different application”. Custom actions in QuickSight come in three main forms: Filter actions, Navigation actions, and URL actions. To enhance our filtering capabilities we will use filter actions in our dashboard, although you should know navigation and URL actions are also very powerful tools and have plenty of applications that are worthy of their own separate discussion.
Filter actions, when applied, allow your users to select a field value in a specific visual. The selections will filter one or more visuals in the same sheet. To put it simply, it allows the user to apply a filter on the fly without you (the owner) manually provisioning filters for that field. Just like standard filters, filter actions are tied to the visual you have selected upon creation.
The Actions pane in your left menu allows you to create a new action, which will open a menu where you will have to select Filter action in the Action type. The Filter scope will determine which fields will have the filter capability option enabled on the rest of the visuals in that same sheet, that you choose under Target visuals.
Example: Adding a custom action in the Clients by Job Title visual so that upon selection of a job it filters Clients List and Clients by Gender.
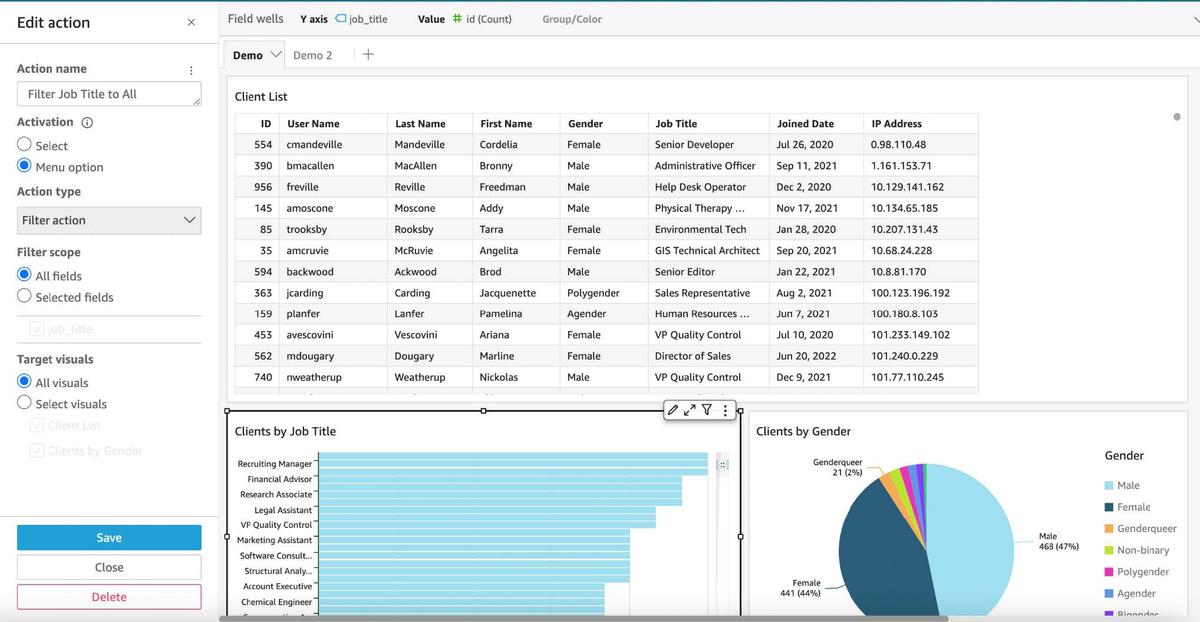
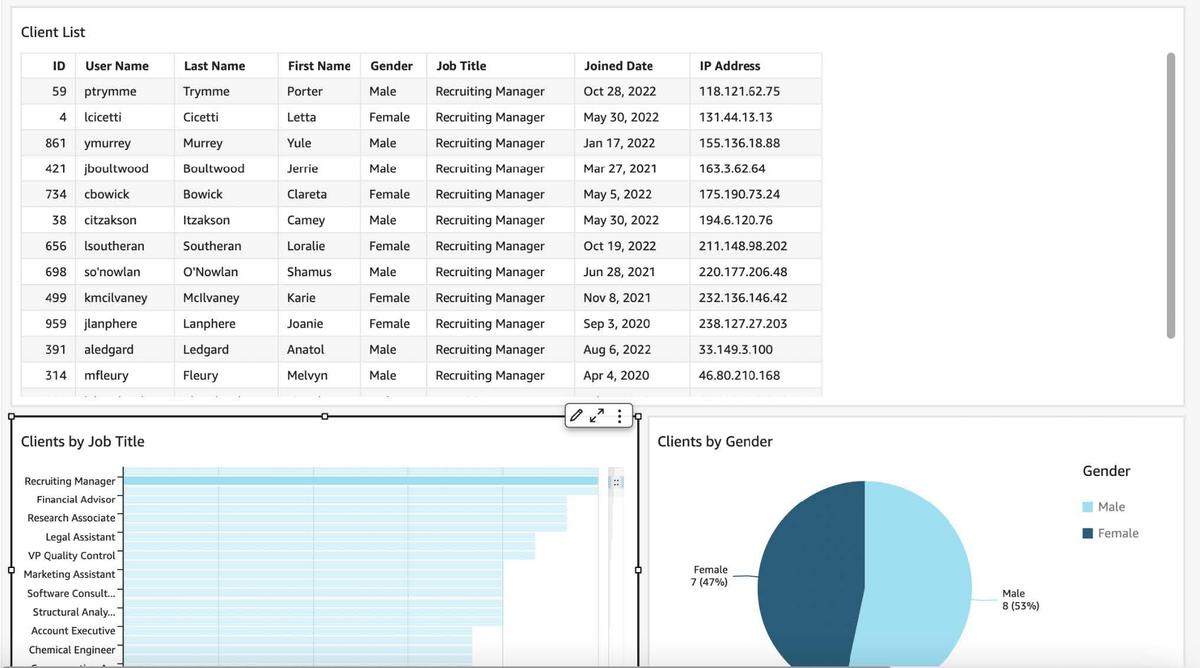
Note that adding an action will not create or modify any of the existing filters in the source or target visuals. The main indicator to your user that an action is being triggered is the automatic color scheme that appears in the source visual; the selected value gets bolded (if its a row in a table) or a dark color is applied to it, while a lighter and transparent color is applied to the rest of the values in the visual.
One of the most interesting features of filter actions is automatically filtering the identical fields from different datasets in your sheet. As a reminder, you initially create analysis from a single dataset but have the ability to create visuals using other distinct datasets in the very same sheet. QuickSight automatically does this matching through field mappings for fields that exist in the multiple datasets being used. At the bottom of the action menu, the view field mapping option will open up a screen that displays the mapping between the initial dataset (one you have created the current visual with) and all the other datasets. This can be a very useful feature and the ability to filter across datasets can be taken to a whole new level through the use of Parameters.
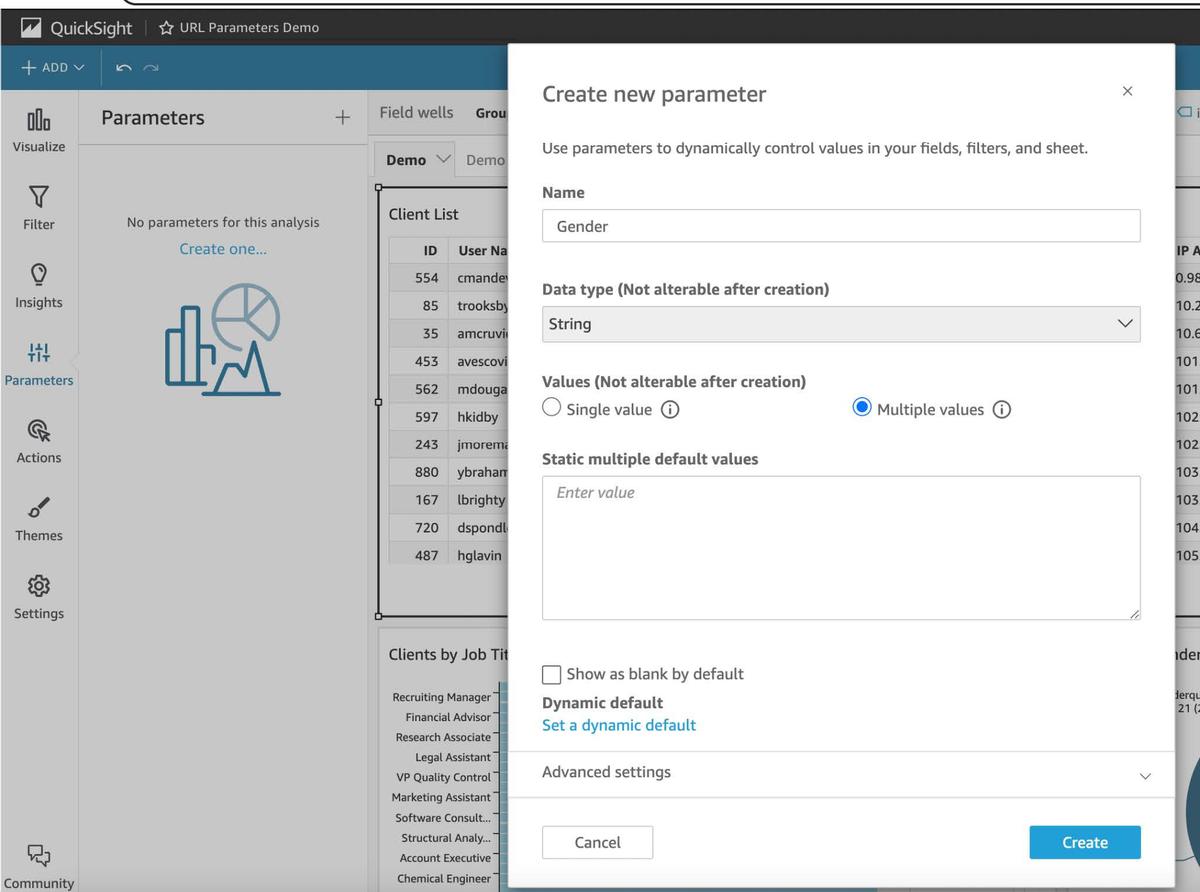
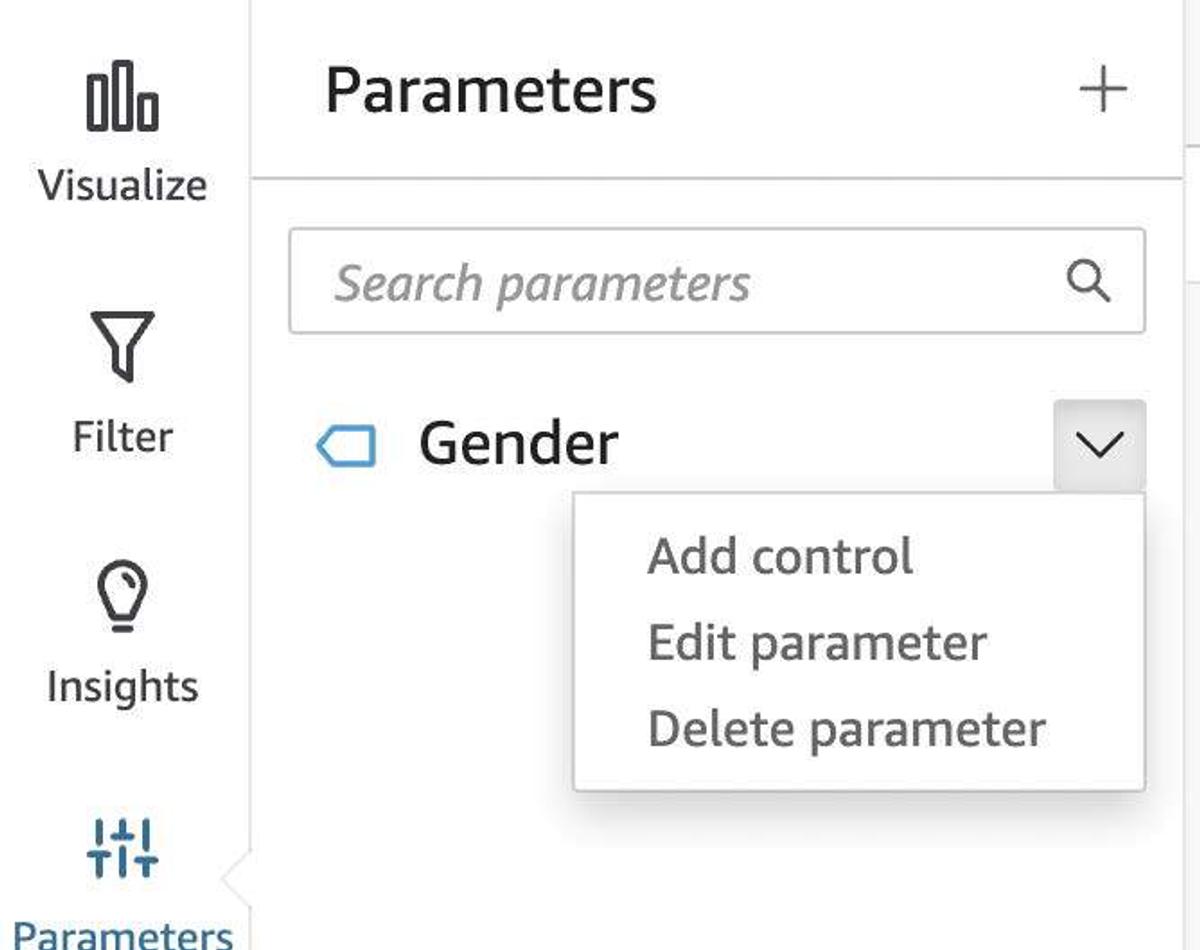
The QuickSight definition of a parameter is “a named variable that can transfer a value for use by an action or an object”. Parameters shine as much as you want them to by using them in the multiple ways that the QuickSight environment allows you to. When it comes to filtering, there are multiple strategies to leverage parameters and bring filtering in your dashboards to the next level. Below are three main implementations of parameters for filtering.
Applying Filters Across Sheets
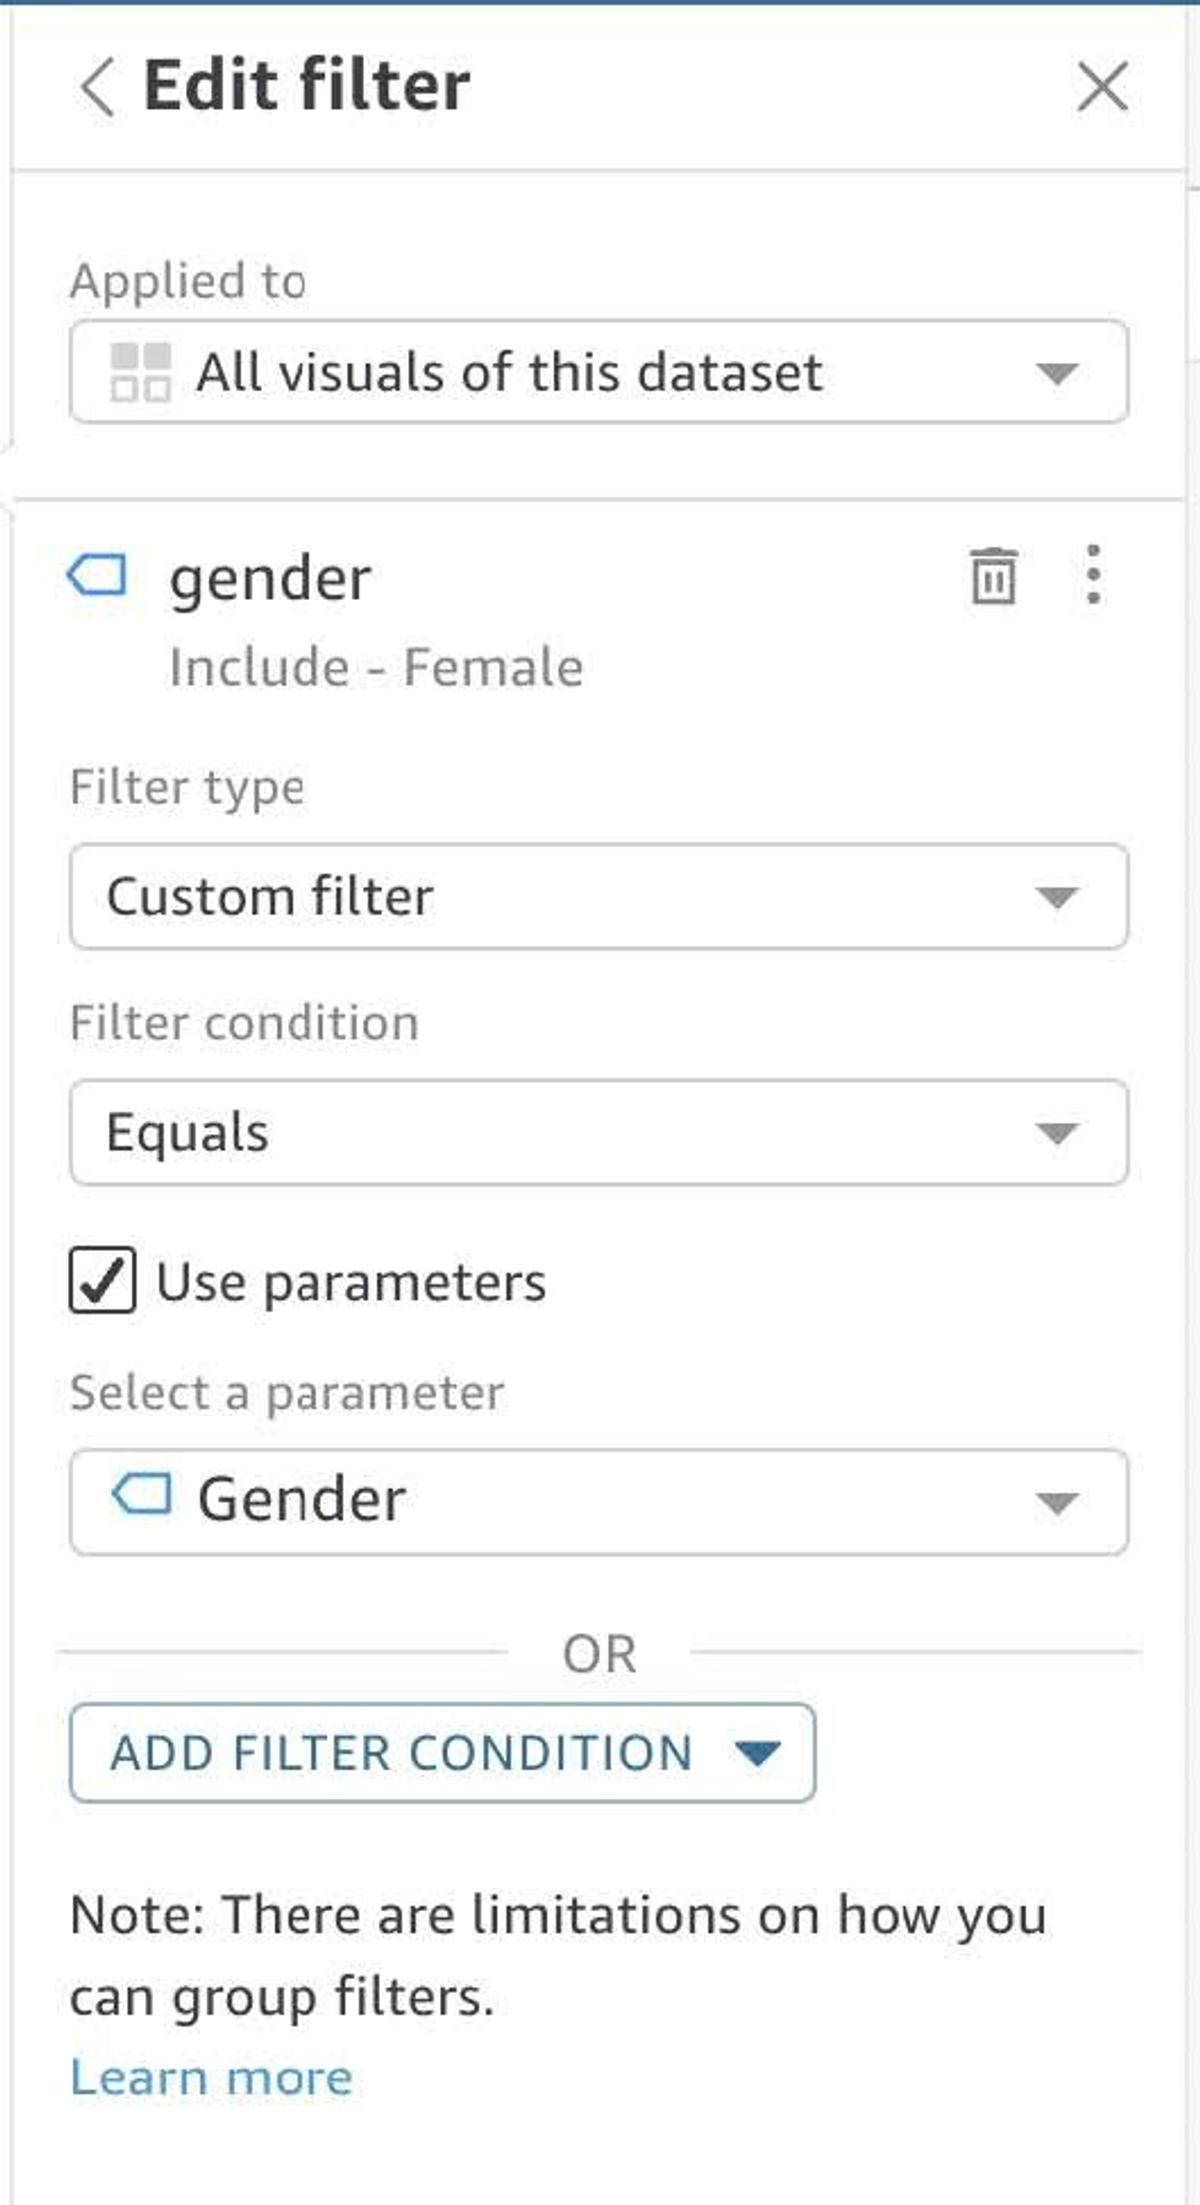
As mentioned, standard filter or filter control upon creation allows us to apply the filter to one or multiple visuals in the same sheets, even visuals from different datasets. However, there will be times when you will want equal filters in different sheets to connect to each other so that users do not have to worry about keeping filters up-to-date as they navigate through sheets in the dashboard.
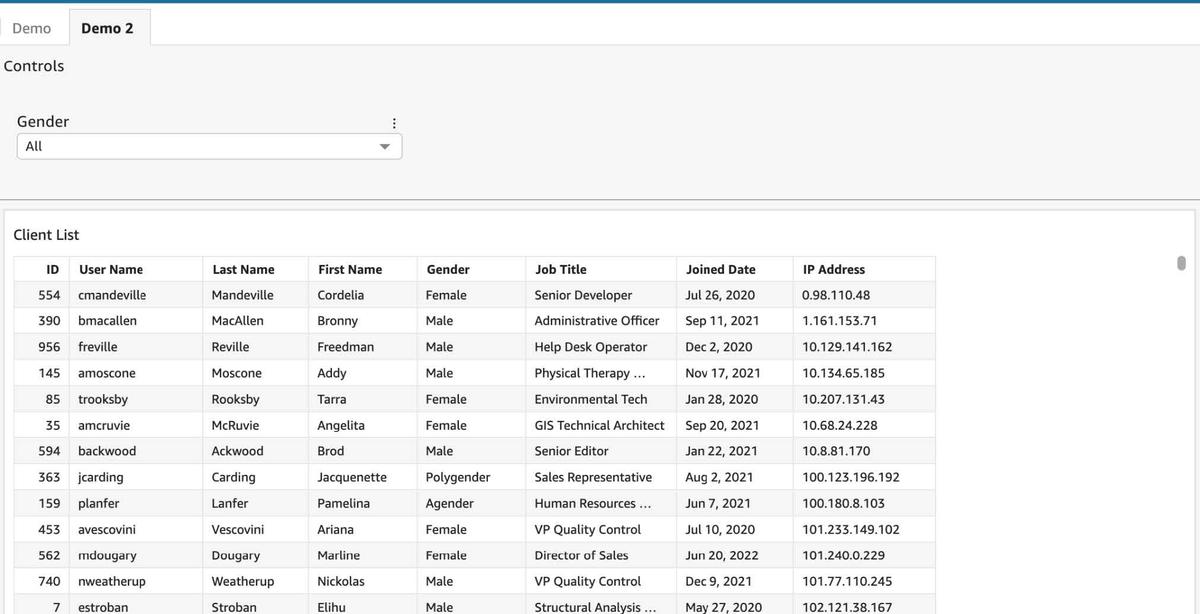
Example: To enforce the Gender filter to transfer through all sheets
Navigation Actions
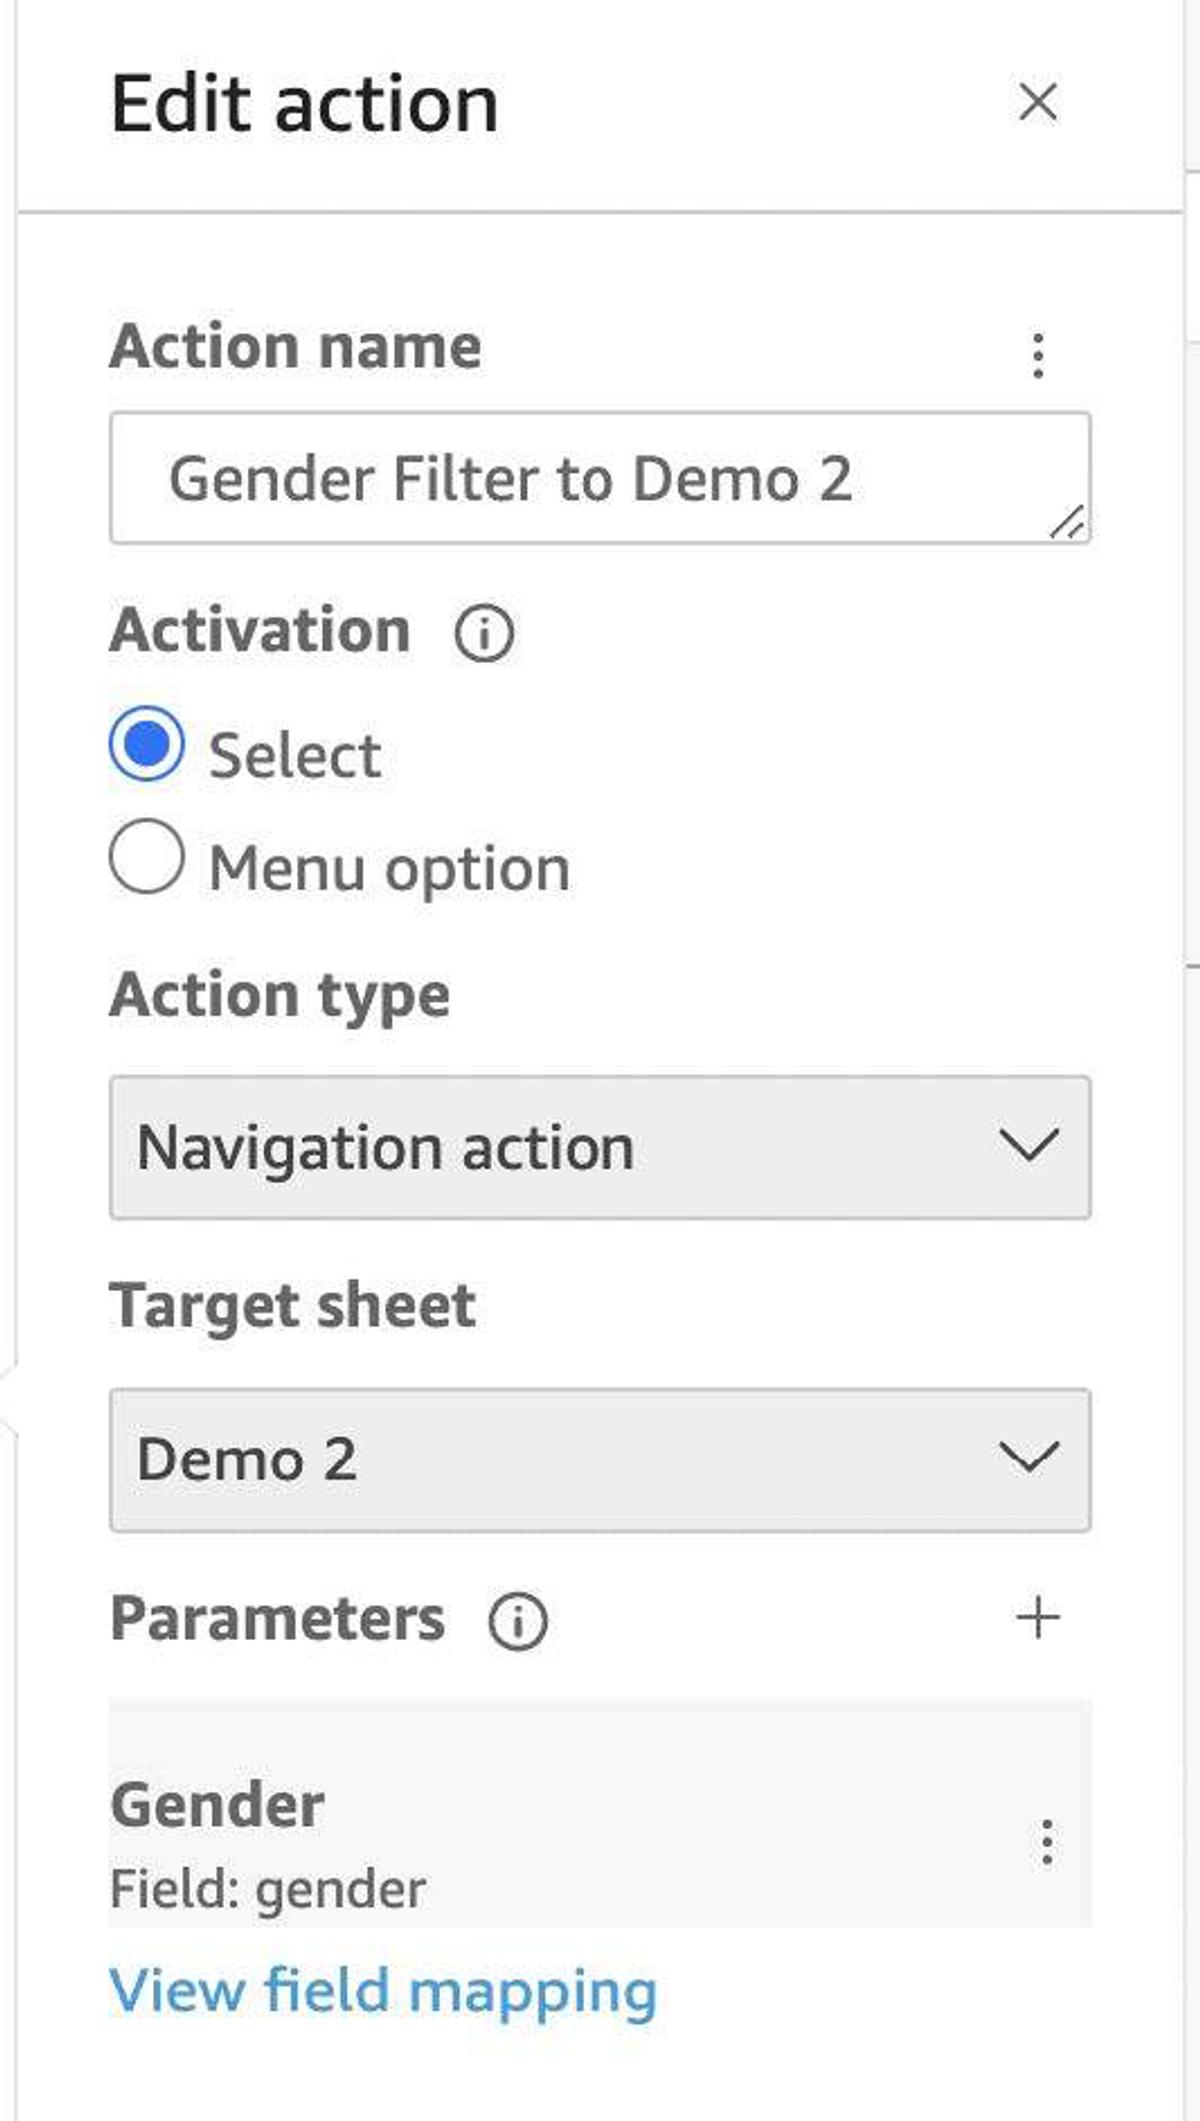
Navigation actions follow the same principle as filter actions but offer cross-sheet capabilities whereas standard filter actions filter the same sheet visuals. The nature of the actions is the same: to allow the user to pass an on-the-fly filter by manually selecting values in a visual.
Example: Creating a navigation action in the Demo sheet that applies to visuals in the Demo 2 sheet.
Navigation actions are powerful tools but should clearly identify when there is a need for them and when you need standard custom actions. Implementing both types of actions in the same visual can be done but can get chaotic very quickly. Navigation actions are handy for cross-sheet filtering but have even more use cases in linking access to data between one sheet and another in the same dashboard.
URL Parameters
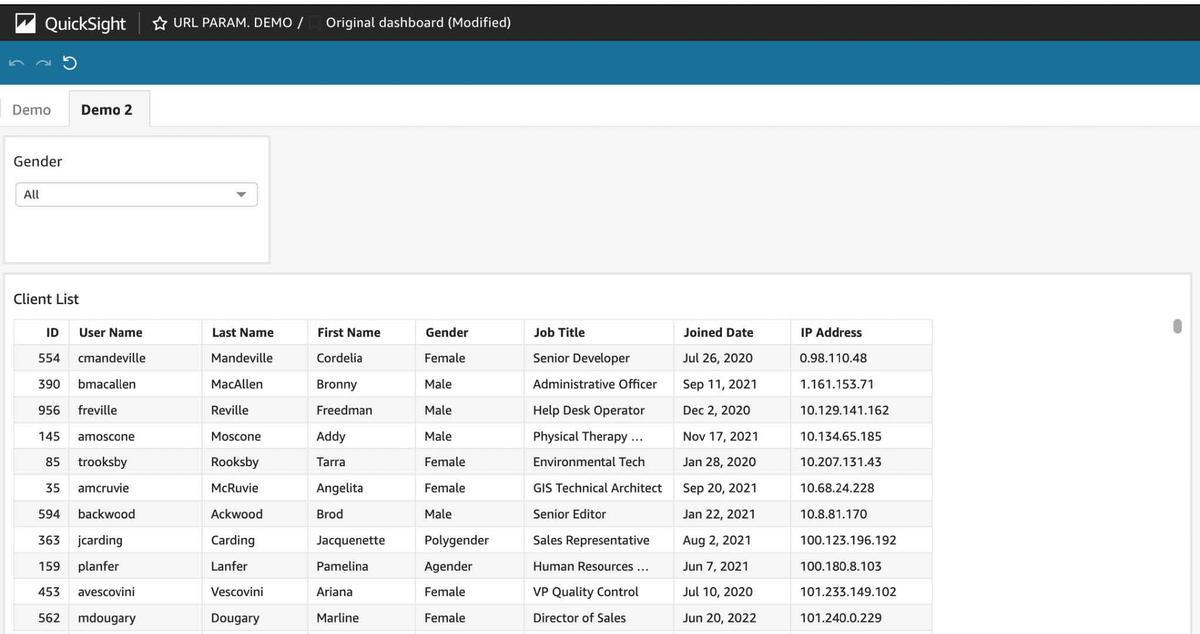
URL parameters allow you to add a query-like string at the end of your dashboard URL to automatically apply filtering to your visuals upon loading the dashboard and without manually interacting with the filter controls. In QuickSight, that is adding the string #p.parameter to said URL to set that filter to a specified value for a given dashboard, resulting in the following:
https://us-east-2.quicksight.a...
We posted a complete step-by-step explanation of how to implement URL parameters on the Trek10 blog, see it here.
At this point, you should have a good understanding of all the ways you can implement filtering in your dashboards. Applying some of these strategies can be tricky at first; start simple and start complicating things by building on a simple base. If you are interested in advanced solutions and implementations in Amazon QuickSight, please contact us.
Disclaimer: The dataset being has been randomly generated and doesn’t represent any real data.

Explore the Blues Cell + Wifi communication module on a Raspberry Pi Zero, Notehub, and thoughts on the pros and cons of utilizing Blues in your IoT project.