Serverless
Replacing Amazon S3 Events with Amazon S3 Data Events
How to synthesize an (almost) identical payload using Amazon EventBridge rules.


One of the worst feelings in ops is when an end user alerts the product team of an outage or service disruption. Have you ever had this happen to you because someone introduced a new AWS service and the devops team didn’t know to monitor it? Or, have you ever thought to yourself as you roll out the newest shiniest service released at re:Invent: “How am I going to monitor this?” The answer to both of those questions starts with CloudWatch metrics.
CloudWatch metrics are not only the unsung hero of AWS, but they are also criminally undervalued within the operations of IT workloads everywhere. In this post we are going to highlight what CloudWatch metrics are, the value they provide, how they fit in the devops lifecycle, and a useful tool we have built around them.
Let's start with the building blocks of what CloudWatch metrics are (if you already know feel free to skip to the next paragraph). Basically each AWS service has a list of metrics that AWS considers relevant to how that specific AWS service is performing. AWS will only make metrics available that they think carry some value. For a classic service like EC2, AWS will let you monitor things like CPU. In contrast, for heavily managed services such as SNS, AWS will not let you monitor the CPU of the underlying resources managing the SNS topic—instead they let you monitor things like the number of messages not delivered. If you want a little hands-on experience using CloudWatch but you are still getting familiar with the cloud we would recommend checking out this lab that our friends at A Cloud Guru put together: https://acloudguru.com/hands-on-labs/using-cloudwatch-for-resource-monitoring .
Here is where the magic kicks in: the more managed services you use, the less work you will have to do setting up the application; thus, the less work you have to do to set up traditional monitoring for them. Instead of adopting an ever-expanding list of third party services or creating countless homegrown monitoring solutions with AWS, you are guaranteed CloudWatch metrics. Below is a chart with examples demonstrating how you would monitor something homegrown compared to monitoring its AWS managed service counterpart:
Functionality | AWS Managed Service | Something you can monitor in AWS | How to monitor a homegrown solution |
Sending emails | AWS Simple Email Service (SES) | All available metrics are listed here, including bounce and compliance rate | To monitor bounce rate you would either need to use a third party mailing service or manually track email bounces in your application |
Storing objects | AWS Simple Storage Service (S3) | All available metrics are listed here, including size of bucket and # of items in the bucket | To monitor something such as # of items in the bucket you would need to either keep a small database up to date, continuously pull the number of stored items, or use a third party service. |
Routing Requests | AWS Application Load Balancer (ALB) | All available metrics are listed here, including 5xx errors and 4xx errors | On a home grown Load Balancer you would need to use custom plugins (such as the Datadog integration for HAProxy) and a custom solution to store the metrics, or to process the logs to create your own metrics. |
When monitoring application-specific functionality, we recommend using Datadog’s API, Agent, and logs to gain full visibility, but that’s a story for a different blog post.
I know I got ahead of myself and started showing you how awesome CloudWatch Metrics are and the value they provide in the table above. It can’t be understated that for most AWS services you get a truly solid fundamental indicator of service performance. To see a list of all the AWS services that publish CloudWatch metrics and links to those metrics check out this AWS documentation.
The best way to see this value is to pick an AWS service and walk through its associated CloudWatch metrics. Say, for example, you wanted to use AWS Web Application Firewall. Since it’s a managed service, AWS handles executing the WAF rules we have defined, but we may want reporting on what the WAF is doing. Namely, if our application isn’t letting traffic in, then we may want to share info with business stakeholders about how many and what percentage of requests aren’t making it through. Or, we may want to let our internal security team know which rules are blocking the most traffic and have the ability to give them insights into which types of attacks are currently popular. Once the rules have been defined in WAF, we can head over to documentation about WAF CloudWatch Metrics. We can see in the documentation that AWS provides us with metrics for the number of requests not compared to any rule, the number of requests blocked by a specific rule, the number of requests counted (i.e. flagged as suspicious) by a certain rule, and the number of requests allowed. Each of those metrics can be broken down across the various “CloudWatch dimensions”, i.e. region, rule group, rule, and web ACL was used to iterate on the metric. Said another way, we can look at blocked requests per region, and see which rule and Web ACL that request counted towards. Looking at the screenshot below, our security team can conclude that the reputation list is what is blocking a majority of the malicious requests to the application and thus they should invest more time keeping that IP reputation list up to date.
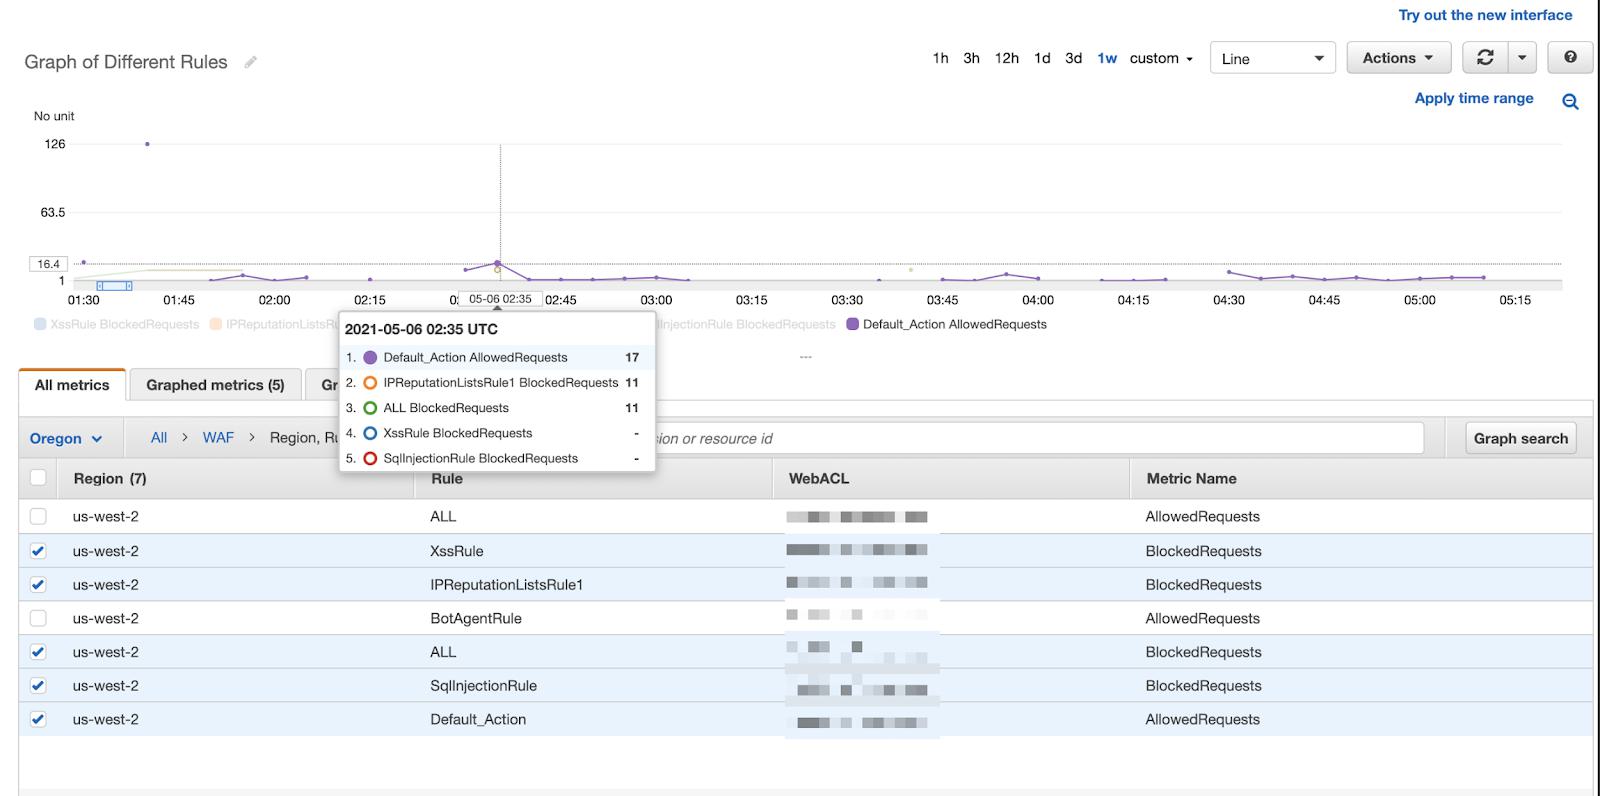
The security team could draw this assumption by seeing that 17 requests were “allowed” or deemed to be safe traffic, while 11 requests were flagged as potentially malicious and blocked thanks to the IPReputationlist rule and no requests were flagged from the xss or sql injection rule. CloudWatch metrics are giving us insight in near real time as to which WAF rules are catching malicious traffic and we can make actionable recommendations off of these metrics.
We aren’t saying CloudWatch metrics are the only thing that one needs to monitor for their application in AWS, but they are by far the most important thing to monitor. In fact many environments we manage use only application up/down monitoring, log monitoring, and CloudWatch metric monitoring with a large percentage of the monitors being CloudWatch monitors.
It is common to hear things like “Cloud adoption is a journey,” “crawl, walk, run” and other sayings that reinforce the idea that building applications in AWS is a living process; monitoring these applications happens to be very much of a living process as well. A critical part of adopting DevOps is lifecycle management, but the "dev" side has traditionally had the most well-defined lifecycle. Operations used to have definition inside on premise data centers, but in the cloud has been largely up for debate. As DevOps has continued to evolve, the “ops” side has seen all its well-defined barriers torn down and turned more and more into the Wild West every day. We are currently at a time when best practices are still not defined and likely some major building blocks still haven’t been released (think of when AWS was just a handful of services). The three biggest questions we are asked would be: (1) Is sticking to AWS services when possible a principle for both building and monitoring or just building? (2) Should monitors & dashboards follow the same model of Infrastructure as Code? and (3) How do I know I am monitoring the right CloudWatch metrics?
While each of those questions deserves its own blog post, I will cover how we use CloudWatch metrics in the lens of those questions while explaining some of the pros and cons.
To recap: internally, we use and have seen the most value of a combination of AWS CloudWatch and Datadog. Specifically, we use Datadog’s monitoring engine as a way to alert on CloudWatch metrics because of all the benefits it provides while using pieces of AWS/Cloud best practices of using IaaC to provide our team an easy and efficient way to keep monitors up to date. In the next section of this article, we will outline how to keep up to date with CloudWatch metrics as your application progresses through its lifecycle.
Revisiting the question we asked at the beginning of the blog: have you ever been surprised by an outage, think the customer calling to let you know it is down, because you weren’t monitoring the right metric, specifically the right CloudWatch metric? Yeah, we have too. After stubbing our toe a couple times, our CloudOps Team team decided to invest in creating a solution that will relieve this pain point and we are excited to now announce this tool is available to you via the Datadog marketplace! “Trek10 Coverage Advisor'' first looks at the CloudWatch metrics being reported to your Datadog account and then it checks to see if there are any monitors in the Datadog account that correspond to that AWS service in order to deduce a list of services that do not have corresponding monitors. Trek10 Coverage Advisor compares this list of services without monitors against Trek10’s internal database of metrics that are the best indicators of AWS service health and should therefore have corresponding monitors. We created this internal Database by having AWS certified engineers read over CloudWatch documentation, use their own first hand experience, and reach out to SMEs to highlight the CloudWatch metrics that are valuable to monitor. The internal database also includes a short description of why monitoring that metric is important. If we see a metric being reported that is valuable and whose service doesn’t have monitors, we will automatically push an event to your Datadog account to let you know. Additionally, we provide you with a dashboard that shows off some pretty cool information. The dashboard highlights a list of recent recommendations which each include a metric to monitor and its description. Every recommendation is indicative of a CloudWatch metric that AWS made available, that metric exists in Trek10’s internal database of valuable CloudWatch metrics, and the observation that your current Datadog account doesn’t have a monitor of that service.
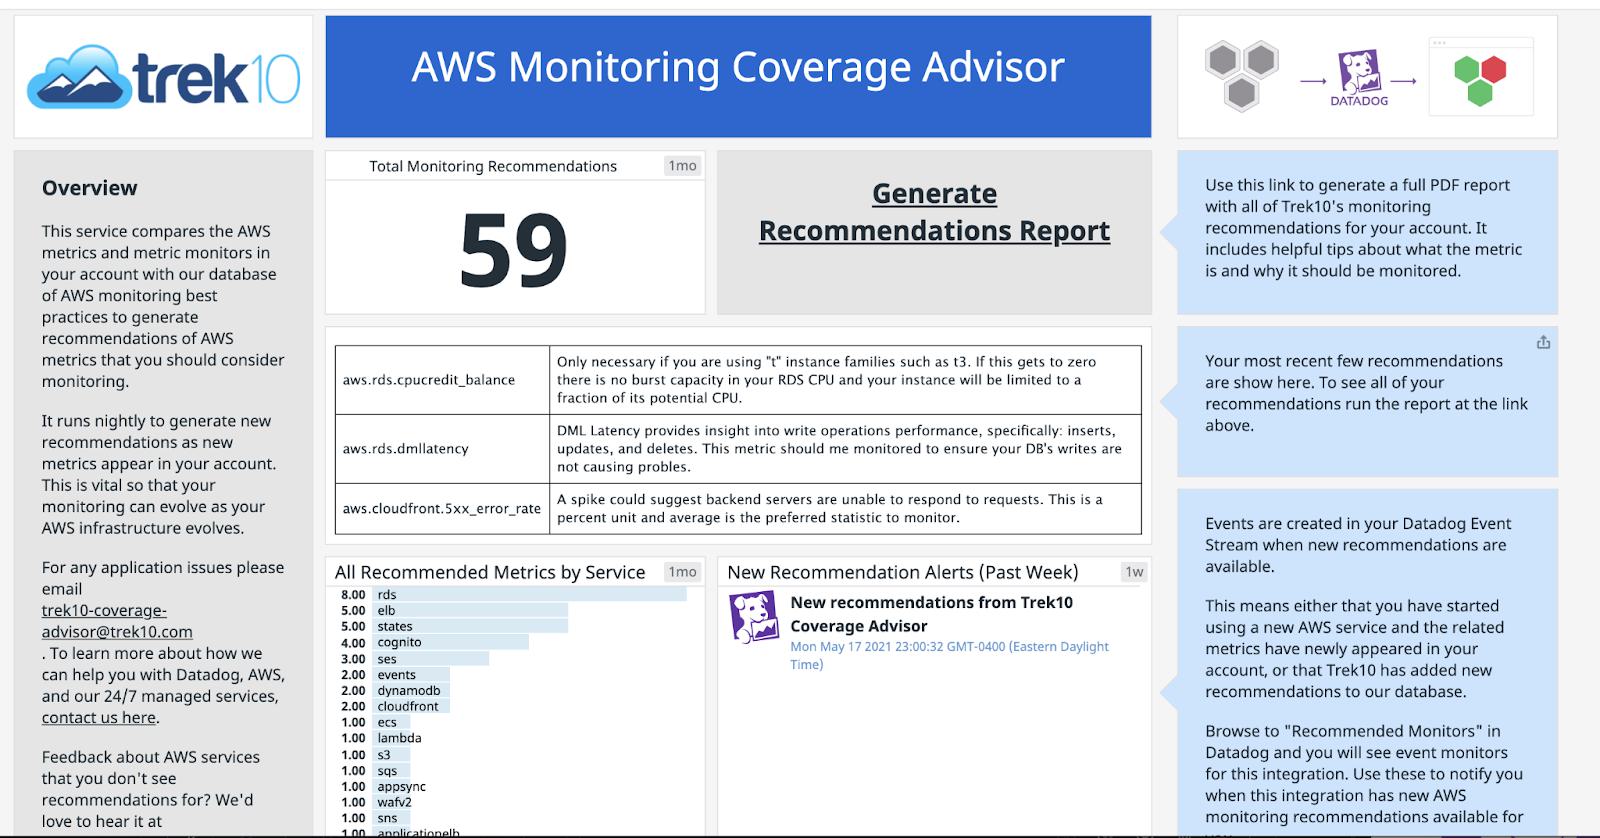
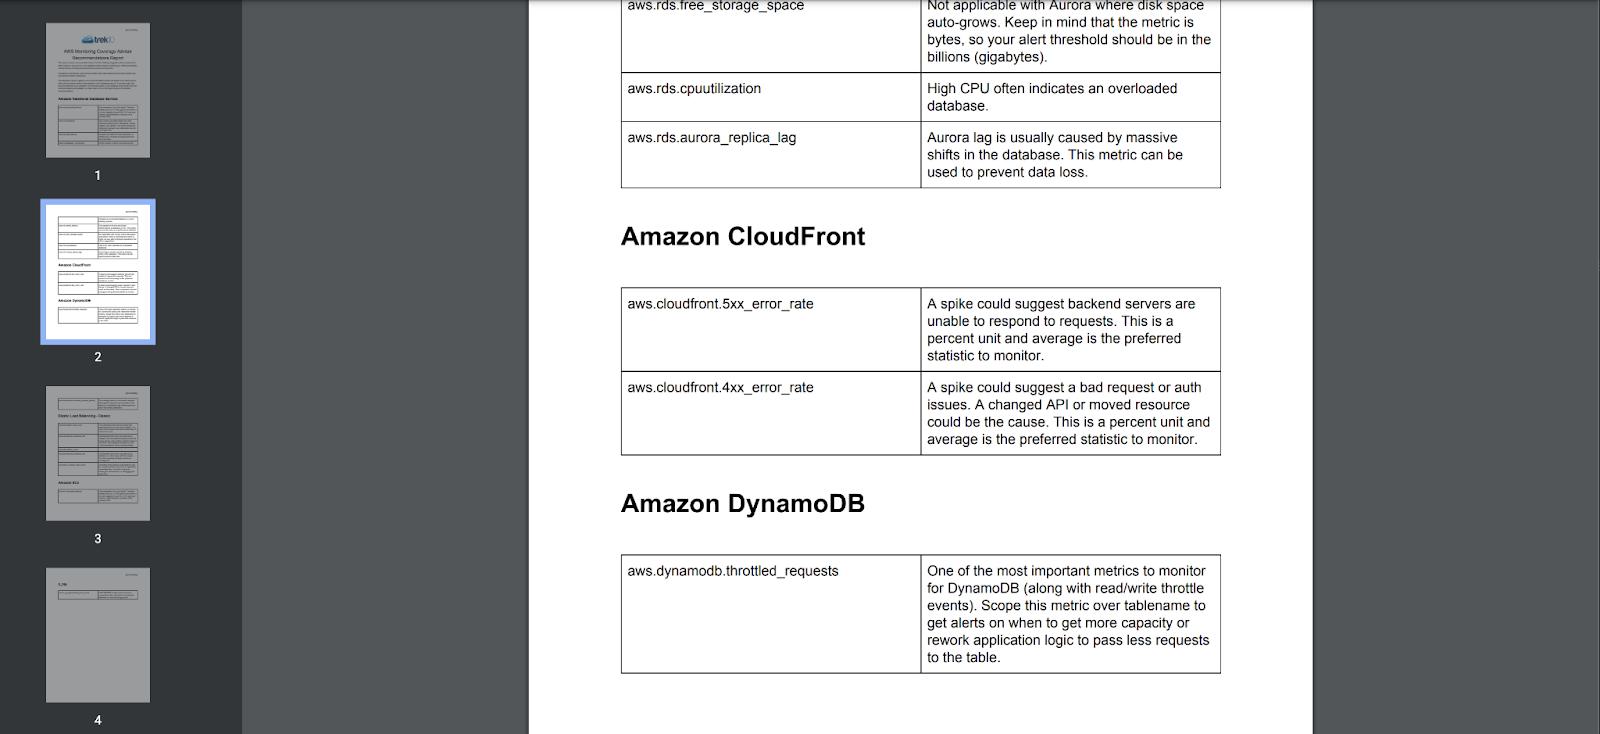
The dashboard also includes a button for you to “Generate a Recommendation Report.” If you click that button you will be prompted to download a report. This report includes a comprehensive list of recommendations as seen below:
We use a flavor of this tool internally with our CloudOps practice to make sure we are monitoring our clients’ CloudWatch metrics and we are really excited that this tool is now available to the public. So instead of worrying about which CloudWatch metrics to monitor: Put the pager down. Grab a beer, and enjoy the soft summer breeze of CloudWatch in the air.
P.S. go on over and check out the marketplace for other cool integrations like RapDev’s Microsoft 365 integration. If you don’t see the integration you’re looking for, please contact us and we would love to discuss how to get that monitored for you.
Be on the look out for the following blog posts coming out later this year:

How to synthesize an (almost) identical payload using Amazon EventBridge rules.