Spotlight
Demoing the Blues Wifi + Cell Communication Module
Explore the Blues Cell + Wifi communication module on a Raspberry Pi Zero, Notehub, and thoughts on the pros and cons of utilizing Blues in your IoT project.


A data warehouse is simply a system that receives data from multiple sources for the purpose of data analysis. Usually, it is used as a key component of business intelligence by integrating data from multiple sources so that the business can make better decisions.
Data warehouses are optimized for low-cost storage & querying large data sets. In AWS, you can build a simple and low-cost data warehouse with Amazon S3, querying it with Amazon Athena, and building reports with Amazon QuickSight. (S3 is also the preferred location for a larger-scale enterprise data lake.)
On the other hand, transactional databases used for user-interactive applications need to be optimized for fast reads & writes of individual rows of data. In AWS, Amazon DynamoDB is a great choice for this use case. However, DynamoDB is very inefficient for data warehouse workloads. So you need to get your data out of DynamoDB and into a data warehouse to derive business intelligence value.
But how do you get the data from your transactional database to your data warehouse? That’s where data streaming comes in. In this post, we’ll walk you through how to get your data from DynamoDB into a data warehouse in Amazon S3 and then build reports to derive business value.
A data warehouse solution can range from simple to more advanced depending on the number of sources you need to pull data from. For the purpose of this article, I will be giving a guide to a simple data warehouse that can easily be done as a first project while keeping costs low for the beginner looking to work on a project.
In this example, we will be utilizing Amazon DynamoDB as the database service and an AWS Lambda function using the AWS Serverless Application Model (SAM) and AWS CloudFormation. Below we are creating a CloudFormation template that defines the resources needed for our solution. This is assuming an AWS account has already been set up and you have access to all the services AWS provides.
Here is an example of what a CloudFormation template for a simple data warehouse solution might look like:
AWSTemplateFormatVersion: '2010-09-09'
Transform: ‘AWS::Serverless-2016-10-31’
Description: Simple data warehouse solution using DynamoDB and Lambda

Resources:
  # Define an S3 bucket for storing data
  DataBucket:
    Type: AWS::S3::Bucket
    Properties:
      BucketName: my-datalake-bucket

  # Define a DynamoDB table for storing data. This is where your data will be processed and queried.
  DataTable:
    Type: AWS::DynamoDB::Table
    Properties:
      TableName: my-data-table
      AttributeDefinitions:
        - AttributeName: id
          AttributeType: S
      KeySchema:
        - AttributeName: id
          KeyType: HASH
      BillingMode: PAY_PER_REQUEST
      PointInTimeRecoverySpecification:
        PointInTimeRecoveryEnabled: true
      StreamSpecification:
        StreamViewType: NEW_IMAGE

  # Define a Lambda function for loading data out of the DynamoDB table to s3 bucket
  DataLoaderFunction:
    Type: AWS::Serverless::Function
    Properties:
      Handler: index.lambda_handler
      Runtime: python3.9
      Timeout: 60
      CodeUri: src/
      Environment:
        Variables:
          DataBucket: !Ref DataBucket
          DataTable: !Ref DataTable
          TABLE_NAME: 'my-data-table'
      Policies:
        - DynamoDBCrudPolicy:
            TableName: !Ref DataTable
        - S3CrudPolicy:
            BucketName: !Ref DataBucket
      Events:
        DynamoDB:
          Type: DynamoDB
          Properties:
            Stream: !GetAtt DataTable.StreamArn
            StartingPosition: LATEST
            BatchSize: 100

Outputs:
  DynamoDBArn:
    Value: !GetAtt DataTable.Arn
  FunctionArn:
    Description: 'DynamoDB handler function ARN'
    Value: !GetAtt DataLoaderFunction.Arn
  S3BucketNameArn:
    Description: Arn of the S3 bucket
    Value: !GetAtt DataBucket.Arn
This SAM template defines an S3 bucket for storing data, a DynamoDB table as the database, and a Lambda function for loading data out of the DynamoDB stream and into the S3 bucket.
To use this template, you would deploy this as a SAM template using the AWS Management Console, AWS CLI, or AWS SDK. This would create all the resources defined in the template, including the Lambda function that loads data from the DynamoDB table to the S3 bucket. The code for the Lambda function itself is below.
import json
import boto3
import datetime
import os
from decimal import Decimal
from boto3.dynamodb.types import TypeDeserializer

#Fixes convert decimal to float error
class DecimalEncoder(json.JSONEncoder):
    def default(self, obj):
        if isinstance(obj, Decimal):
            return float(obj)
        return json.JSONEncoder.default(self, obj)

td = TypeDeserializer()
s3 = boto3.client('s3')
""" below will grab each record in the dynamodb table and iterate over each to pull the version and set the date correctly in s3. """
def lambda_handler(event, context):
    bucketName = os.environ['DataBucket']
    DataSource = os.environ['DataTable']

    for record in event['Records']:
        print("Processing Record", record['dynamodb'])
        if record['dynamodb'].get("NewImage", None) is not None:
            print("Processing NewImage")
            raw = record['dynamodb']['NewImage']
            newImage = {k: td.deserialize(v) for k,v in raw.items()}
            eventSource = record['eventSource']
            version = newImage.get("Version", "0")
            currentTs = datetime.datetime.now()
            key = "{}/{}/{}/{}/{}/{}.json".format(DataSource, version, currentTs.date().year, str(currentTs.date().month).zfill(2), str(currentTs.date().day).zfill(2), currentTs.isoformat())

# export JSON to s3 bucket
    body = json.dumps(newImage, cls=DecimalEncoder)
    print(bucketName, key)
    response = s3.put_object(Bucket=bucketName, Key=key, Body=body)
You can schedule the Lambda function to run on a time interval in order to retrieve any new data coming into the database. Or you can manually launch the Lambda function whenever you need to pull and store the data. By following these steps, you can set up a simple data warehouse solution on AWS that uses an S3 bucket as your warehouse, DynamoDB as your database, and a Lambda function to move the data over. This can easily be adjusted if you have an outside data warehouse source.
A quick and easy way to get value out of the S3 data is by creating a report with Amazon QuickSight. QuickSight must be granted access to the S3 bucket you want it to read from first. To launch an Amazon QuickSight report with S3 data you would log into your QuickSight account. Click “New Analysis”, and choose “New Data Set”.


Select “Amazon S3” as the data source.
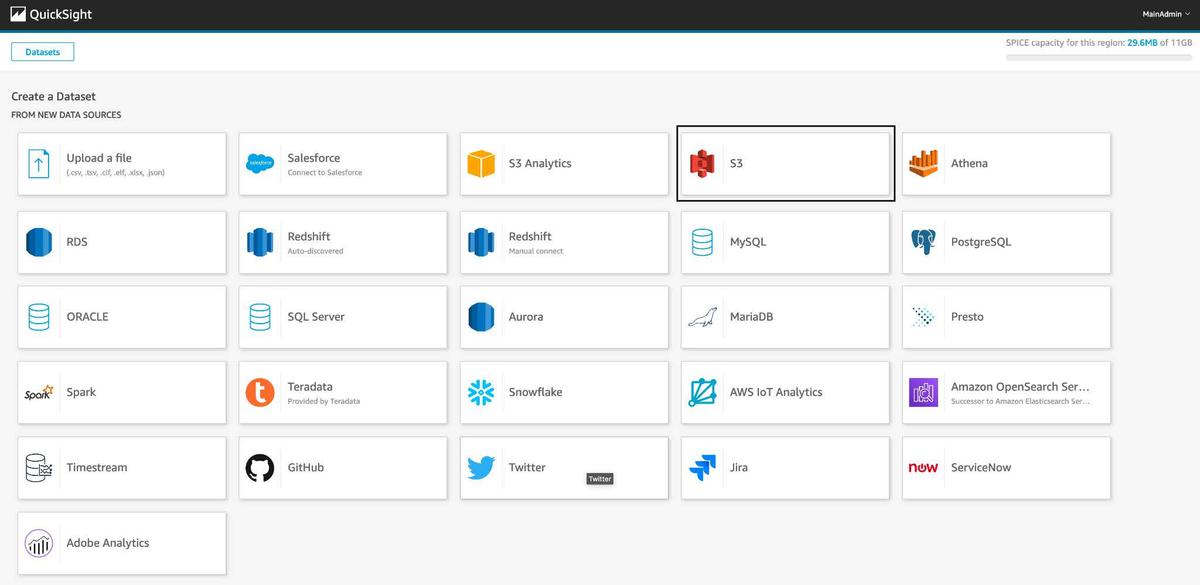
From there you will enter your S3 bucket information and select the data file you want to use. Continue creating the data set by following the instructions to set up the report. Once the data is loaded, you can easily use QuickSight’s visualizations and tools to analyze and present the data in the report. You can then publish and create a dashboard off of the report.

This is a simple way to quickly visualize the S3 data we pulled above and to allow business intelligence to have real-time insights and analysis.
This solution can be easily expanded and customized to meet the needs of your business. With this solution, you can deliver historical data to a location that is easily accessible in the future or create metadata for business intelligence.

Explore the Blues Cell + Wifi communication module on a Raspberry Pi Zero, Notehub, and thoughts on the pros and cons of utilizing Blues in your IoT project.